


 Spring 2001 Update
The three components
of the GP-1 system accomplish the four major tasks required to produce
the screen plot showing the estimated location of lightning activity.
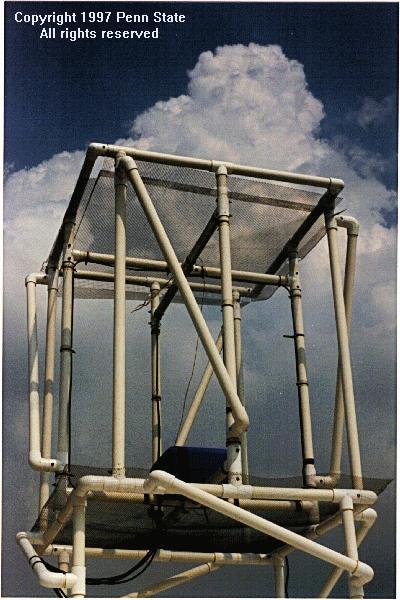
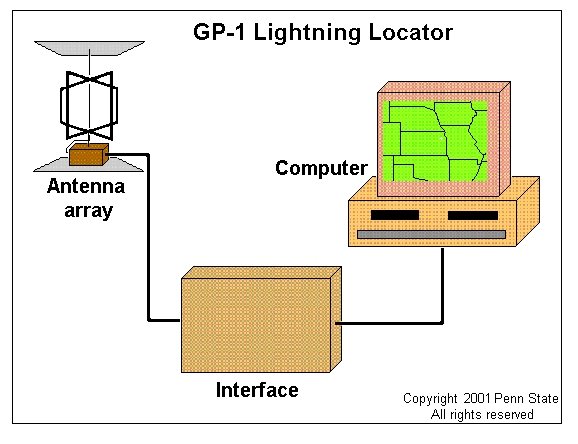 The GP-1 Lightning Locator system
consists of three basic components. The antenna array, mounted several
meters above the ground, intercepts the electromagnetic field radiated
by distant lightning. The interface captures and digitizes the peak magnitudes
of the antenna signals. The computer processes the digitized data and plots
the estimated location of the lightning activity on the monitor screen
map.
The GP-1 Lightning Locator system
consists of three basic components. The antenna array, mounted several
meters above the ground, intercepts the electromagnetic field radiated
by distant lightning. The interface captures and digitizes the peak magnitudes
of the antenna signals. The computer processes the digitized data and plots
the estimated location of the lightning activity on the monitor screen
map.
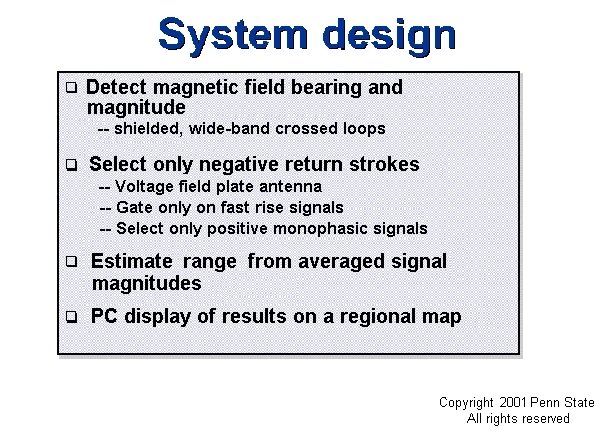 First, the magnetic field
strength and the bearing of the return stroke must be detected. The crossed
loops of the antenna array derive the signals for this item.
First, the magnetic field
strength and the bearing of the return stroke must be detected. The crossed
loops of the antenna array derive the signals for this item.
Next, the voltage part
of the antenna array produces signals that allow identification of the
stroke polarity and the stroke type, return or intracloud, signature. Once the Interface circuits
have captured the appropriate peak magnitudes and have sent them in digitized
form to the computer, the software algorithm selects only the negative
return strokes and performs the trigonometry on the magnetic field signals
to find the stroke bearing and magnitude. Finally, the stroke magnitude
in the bearing is averaged with previous strokes in the same bearing, and
the results used to plot the estimated range from the screen map center
along the bearing of the current stroke. The screen background is a unique,
site-centered map of the surrounding few hundred kilometers.
 An example of the GP-1 display from
the Penn State Meteorology Department Weather Station (Walker Building)
installation, obtained on September 7,1998 at 13 UTC (Greenwich Mean Time). The line of lightning activity
can be seen along the Pennsylvania/Ohio border by the most recent strokes,
shown in yellow, occurring on the line's eastern edge. The older
strokes, shown in red, are along the far western edge. Over the past hour,
the total activity has increased from about 40 negative returns (NR) per
minute to about 55 (yellow dots on the graph in lower right corner). The blue numbers on the bottom indicate stroke statistics.
Note: If a search engine brought you directly to this page, then go to the
GP-1 Start Page.
The Web address for the GP-1 Start Page is http://bub2.met.psu.edu/default.htm
An example of the GP-1 display from
the Penn State Meteorology Department Weather Station (Walker Building)
installation, obtained on September 7,1998 at 13 UTC (Greenwich Mean Time). The line of lightning activity
can be seen along the Pennsylvania/Ohio border by the most recent strokes,
shown in yellow, occurring on the line's eastern edge. The older
strokes, shown in red, are along the far western edge. Over the past hour,
the total activity has increased from about 40 negative returns (NR) per
minute to about 55 (yellow dots on the graph in lower right corner). The blue numbers on the bottom indicate stroke statistics.
Note: If a search engine brought you directly to this page, then go to the
GP-1 Start Page.
The Web address for the GP-1 Start Page is http://bub2.met.psu.edu/default.htm
Page 5 of 10
Page:1|2|3|4|5|6|7|8|9|10