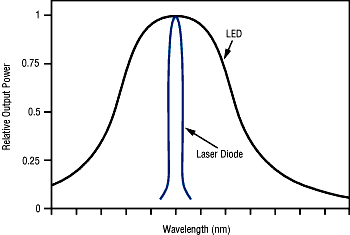
The laser's narrow range of wavelengths allows
more efficient propagation of light
by reducing material dispersion.
Title: Introduction to Fiber Optic Networking - Contents
Author: AMP, Inc.
Company: AMP, Inc.
Lasers and LEDs
The choice of LED or laser for a transmitter depends on the application requirements. Both are small semiconductor chips that emit light when current passes through them. The significant differences between an LED and laser greatly affects the performance of an optical link.
The following are important characteristics of the optical source:
Output power. How much optical power does the source couple into the fiber? Both LEDs and lasers used in network/premises cabling applications couple tens of microwatts of optical power into a fiber. The amount coupled from a given device depends on the fiber's core diameter and NA. The light from an LED spreads out in a wide pattern so that only a small portion of the total light emitted is actually coupled into the fiber. A fiber with a large core or a higher NA gathers more of this light. For example, an LED might couple 45 microWatt into a 62.5/125 fiber, but only 35 microWatt into a 50/125 fiber. The difference is due to the larger diameter and NA.
A singlemode fiber generally requires a laser source. Unlike an LED, a laser produces a very narrow beam of light matched to the small core of the fiber. While lasers used in premises cabling applications couple roughly the same amount of light into a fiber as an LED, the efficiencies of singlemode fibers permit longer transmission distances. In an FDDI network, for example, the span between stations is 2 km for multimode fiber and 40 km for singlemode fibers.
Spectral width. What is the spread of wavelength in the light? An LED emits a wider range of light, while a laser emits a very narrow range. Different wavelengths travel at different speeds through a fiber, which contributes to dispersion and thus limits the fiber's bandwidth. LEDs have spectral widths of around 25 to 40 nm. For an LED with a nominal wavelength of 850 nm, a 40-nm spectral width means that actual range of wavelengths is from 830 nm to 870 nm.

Speed. How fast can the device be turned on and off? The speed at which the source can be modulated determines the data rate it can support.
Detectors
At the other end of the link is the detector, which serves to convert the optical signal back to an electrical signal. The detector must be able to accept highly attenuated power„down in the nanowatt levels. Subsequent stages of the receiver amplify and reshape the electrical signal back into its original shape. Some detector packages have a preamplifier built in to boost the signal immediately.
Detectors operate over a wide range of wavelengths and at speeds that are usually faster than the LEDs and lasers. The most important figure of merit for a detector is its sensitivity: what is the weakest optical power it can convert without error? The signal received must be greater than the noise level of the detector. Any detector has a small bit of fluctuating current running through it; this minuscule current is noise„spurious, unwanted current. The minimum power received by the detector must still be enough to ensure that the detector can clearly distinguish between the signal and the underlying noise. This is expressed as a signal-to-noise ratio or a bit error rate. SNR is a straightforward comparison of the signal level and the noise level, while the bit error rate is a more statistical approach to determining the probability of noise causing a bit to be lost or misinterpreted.
Transmitters, Receivers, and Transceivers
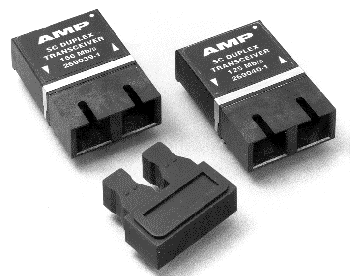
Packaged transmitters and receivers offer a convenient, cost-effective method of achieving the electro-optic interface. Typically in small, board-mounted packages, transmitters and receivers include the necessary circuitry to permit simple building of a fiber optic data link.
A transmitter accepts standard TTL or ECL data, which it converts to light for transmission through the fiber. The receiver accepts the light and converts it back to TTL or ECL signals.

Today's packages are easier to use for a number of reasons. First, package dimensions and pinouts have been standardized so that packages from different vendors can be used interchangeably. Second, specifications for using the devices make building links easier. For example, the output power of a transmitter is now given as the power launched into a given type of fiber. Third, transmitter and receiver packages are offered in matched pairs. That is, you can buy an FDDI set, an ATM set, or an Ethernet set and know that they will meet the published specifications for achieving the speeds and distances allowed by the standards.
Link Power Margin
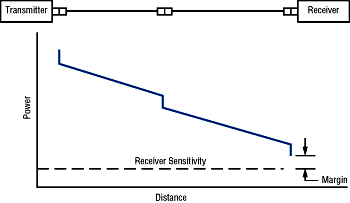
The difference between the power the source launches into the fiber and the minimum sensitivity of the detector defines the link power margin. Suppose, for instance, that the source launches -19 dBm into 62.5/125 fiber and the receiver sensitivity is -33 dBm. The link power margin is 14 dB. During transmission from end to end, from transmitter to receiver, the signal must not lose more than 14 dB of optical power. Sources of loss include not only fiber attenuation, but losses associated with interconnections at patch panels, wall outlets, and so forth. In addition, a prudent power margin reserves 3 dB for aging of the source and fiber repairs.

Most networking and building cabling standards define a power margin. These margins are routinely achievable within the physical limits allowed by the standards. That is, the standards recommend cable distances and the number of interconnections along the path. By following these guidelines, the link should be well within the margin.
Fiber optic networks typically have a link margin of about 11 to 20 dB.
A convenient way to look at a link budget is by graphing the losses along the path. Fiber attenuation can be estimated by assuming loss is linear per unit length. Thus, if the attenuation is 1.5 dB/km, then the loss is 0.75 dB for a 500-meter run. Standards allow 0.75 dB for each interconnection. Add 3 dB for aging. A quick addition of sources of loss in the link will allow a budget to be quickly calculated. In most cases, a measurement of link losses will show losses that will not be as high as calculated. One reason is that most interconnections provide well under 0.75 dB of loss. If the measured loss is higher than the calculated loss, then there is probably something wrong with the installation.