- Preview
- Products
- Catalog
- Receiver Protectors
- Magnetrons
- TWT's
- CFA's
- Transmitters
- Switches
- Pressure Windows
| Magnetrons |  |
|
Typical Magnetron Parameters
As an aid to understanding the parameters normally shown in a magnetron specification, we offer the following:
Thermal Drift
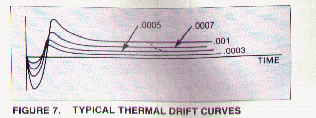
At the time high voltage is first applied to a magnetron, the thermal equilibrium of the device is suddenly altered. The anode vanes being to heat at the tips due to electron bombardment and the entire anode/cathode structure undergoes a transient change in thermal profile. During the time required for each part of the magnetron to stabilize at its normal operating temperature, the output frequency of the magnetron will "drift." The curve of output frequency vs. time during the period following initial turn on is called the "Thermal Drift" curve. Generally speaking, the maximum drift occurs during the first few minutes after turn on, and slowly approaches equilibrium over a period ranging from 10 to 30 minutes depending upon the structure mass, power output, type of cooling and basic magnetron design. Thermal drift curves across a variety of magnetron types operating at the same frequency and output power may differ radically from each other. Each type is usually designed for a particular purpose and subtle differences in the internal magnetron configuration can produce radical differences in the thermal drift curve.
It should be noted that a thermal drift effect will occur not only at initial turn-on, but whenever the peak or average input power to the magnetron
 is changed, e.g., a change of pulse duration, prf or duty. Figure 7 shows typical thermal drift curves for a particular magnetron plotted as a function of duty. The dotted line indicates the effect of a change in duty from .001 to .0005 after thermal equilibrium has been initially achieved.
Temperature Coefficient
After the thermal drift period has expired and a stable operating frequency has been achieved, changes to ambient conditions which cause a corresponding change in the magnetron temperature will produce a change in the output frequency. In this content ambient changes include cooling air temperature or pressure in air cooled magnetrons; mounting plate temperature in heat sink cooled magnetrons; and flow rate or temperature in liquid cooled magnetrons.
The change in magnetron output frequency for each degree change in body temperature, as measured at a specified point on the outside surface of the magnetron body, is defined as the Temperature Coefficient for the magnetron and is usually expressed in MHz/oC. For most magnetrons the temperature coefficient is a negative (frequency decreases as temperature increases) and is essentially constant over the operating range of the magnetron.
When estimating magnetron frequency change due to temperature coefficient, keep in mind that the temperature coefficient relates magnetron frequency to body temperature and there is not necessarily a 1:1 relation between body temperature and, for example, ambient air temperature. In addition, for airborne systems, the cooling effect of lower air temperature at altitude may offset by a corresponding reduction in air density.
Pushing Figure
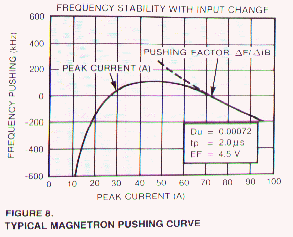
The pushing figure of a magnetron is defined as the change in magnetron frequency due to a change in the peak cathode current. Referring back to the earlier theory discussion, we noted that the resonant frequency of a vane resonator is determined by its mechanical dimensions plus the reactive effect of any perturbation. The presence of electrons in the vicinity of the vane tips affects the equivalent capacitance of the resonator by an amount proportional to the density of the electrons and,
 since electron density is similarly related to peak pulse current, changes in pulse current level will produce changes in output frequency. The pushing figure expressed in MHz/Amp is represented by the slope of a frequency vs. peak current curve plotted for a particular magnetron type.
 From the curve of Figure 8, it can be seen that the slope is not a constant over the full range of operating current. It is therefore meaningless to talk about a specific value for the pushing figure unless one also specifies the range of peak current over which it applies.
It should be noted that since power output is proportional to peak current in a magnetron, the pushing figure at peak current levels well below the normal operating point of the magnetron are usually unimportant because the power output at these current levels is low.
The primary importance of a low pushing figure near the magnetron operating point is that the pushing figure will determine intrapulse FM, and thereby will affect the spectral quality of the transmitting pulse.
The Pulling Figure is defined as the maximum change in output frequency that results when an external, fixed amplitude mismatch, located in the output waveguide, is moved through a distance of one half wavelength relative to the magnetron. Stated somewhat less formally, the pulling figure is a measure of a magnetron's ability to maintain a constant output frequency against changes in load mismatch.
During the design of a magnetron, the degree to which the output waveguide is electrically coupled to the internal resonator structure is selected to optimize certain performance parameters. Strong coupling increases output power and efficiency but also increases time jitter and sensitivity to changes to load mismatch. Generally, the coupling is chosen to obtain the best compromise between efficiency and stability.
Depending upon the phase relation between incident and reflected power at the output port of a magnetron, reflected power will appear as a reactance across the coupling transformer and effectively change the degree of coupling. Therefore, using a fixed mismatch and varying its distance from the magnetron output port will cause the magnetron frequency to shift and the output power to vary concurrently.
To standardize the measurement values, pulling figure is normally measured using a fixed 1.5:1 VSWR; however, in very high power magnetrons a 1.3:1 VSWR is often used. When referring to the pulling figure of a magnetron one should always indicate the VSWR value used in the measurement.