Monitor Programs
The serial data from the loop antenna hardware is analyzed with the WXPIC73 program. The data is sorted into categories with reference to direction-of-arrival. The raw data is stored in several categories: total and burst activity rate, time-between-events, pulse width and polarity. This data is maintained in memory for 8 hours. Periodically (5 minutes), the data is reduced to several activity peaks with descriptors which are archived to a disk file. A number of options to view and/or save selected data are available via keypresses or mouse "point and click".
A brief description of the data display and control will be presented below. A more detailed description, in addition to all program files, is included in the self-extracting pc_pgm.exe file.
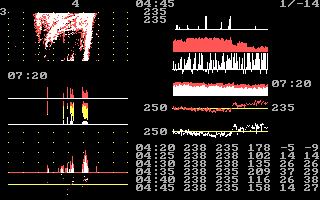
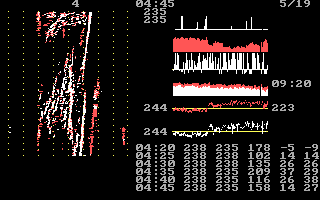
 This example of the monitor display illustrates the normal running display. The upper left is a plot of the last 8 hours of data in 10 minute increments. The plot is updated every 5 minutes with burst (white) and total activity (red). The horizontal axis is direction (3 degrees resolution).
The most current data is located on the bottom line which is also represented by several histograms in the display lower left. From top to bottom, these histrograms describe the following data characteristics:
- Percentage of narrow pulse widths.
- Pulse polarity and widths components.
- Logarithmic plot of total and burst activity.
- Percentage postive events for burst and total activity.
The upper right display is a track of an activity peak for up to the last 8 hours which is selected by the operator (cursor not shown in the demo) for a specific direction from the histogram or a direction/time from the activity/time plot. This data is a summation of data within the peak (concentrated activity over one or more direction channels) which is also the source of descriptors for disk file archiving. From top to bottom, the following peak descriptors are plotted:
- Timing factor change for the last three readouts (15 mins)--0 change at the top.
- Percentage of the narrow pulse widths.
- The time-between-events timing factor.
- Logarithmic plot of burst and total activity.
- Range of percentage positive events for total activity across the peak.
- Range of percentage positive events for burst activity across the peak.
Below the track display, numerical data( peak direction limits , timing factor and burst polarity factors) for a selected time span may be shown.

The archive disk records are formatted in daily files which can be viewed with the SHOWWX program. The display format is similar to the running display except the left display portion is the peak descriptors for the 24 hour period.
The running display can be saved to disk at any time by operator command. These files may also be viewed with the SHOWWX program. In additon, histogram or track plots can be saved to disk in a spreadsheet combatible file (space delimited).
All programs are written in the Forth language, specifically Pygmy Forth. For an introduction to the Forth language and additional description of Pygmy Forth (shareware), the self-extracting file pygmy14.exe may be downloaded.
Question or comments?
Please contact
Dick Fergus W9DTW
rfergus@theramp.net
Revised 11-13-98
 This example of the monitor display illustrates the normal running display. The upper left is a plot of the last 8 hours of data in 10 minute increments. The plot is updated every 5 minutes with burst (white) and total activity (red). The horizontal axis is direction (3 degrees resolution).
