 |
 |
 |
 |
 |
 |
 |
 |
 |
 |
 |
 |
 |
 |
 |
 |
 |
 |
 |
 |
 |
 |
 |
 |
 |
 |
 |
 |
 |
 |
 |
 |
 |
 |
 |
 |
 |
 |
 |
 |
 |
 |
 |
 |
 |
 |
 |
|
|
Return to John K's...DIY Speaker page |
|
|
|
<Back |
|
|
|
|
|
How to measure a Series Crossover... |
|
|
|

|
|
|
|
|
|
Also see: A Novel Way to Measure the Acouctic Output of Individual Drivers of a Loudspeaker. |
|
|
|
Presented here is a short discription of how to measure the response characteristics of a series croosover using the IMP or LAUD. The procedure may be applicable to other measurement software packages, howerer it is necessary to be able to merger (sum and multiply) response curves to obtain the rersults presented. If your measurement software can not perfrom these functions you can take the basic measurements and use the Frequency Response Combiner (FRC) which can be downaloaded form the FRD Consortium page. |
|
|
|
 |
|
|
|
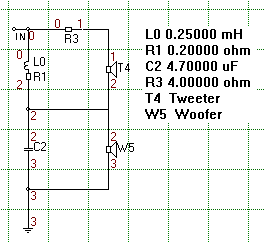
The crossover used in this example is shown to the left and is a simple 1st order series crossover with a tweeter attenualtion resistor. The drivers are Vifa P17WJ-00-09 and D25AG-35-06. There are several steps required to obtain the electrical and acoustic responses of the tweeter and woofer signals. First, the speaker and microphone should be set up in measurement position. Neither should be moved during the course of the acoustic measurements. With the position fixed, the acoustic response of the woofer and tweeter without the crossover attacthed should be measured. Then, with the crossover in place the acoustic response of the system should be measured. This will provide the data as shown below. I performed the measurements using the IMP with MLS, but any measuring system can be used. Each response curver should be saved as *.frd and *.fr2 files (IMP and LAUD version of an importable (frd) and reloadable (fr2) SPL files). |
|
|
|
|
|
 |
|
|
|
Measured system acoustic response |
|
|
|
|
|
 |
|
|
|
Measured Tweeter acoustic response |
|
|
|
|
|
 |
|
|
|
Measured Woofer acoustic response |
|
|
|
|
|
The next step is to make several measurements of the electrical response of the crossover at various points. The first measurement is taken at the tweeter positive terminal. Then a measurement is taken at the tweeter negatiive terminal. In this simple crossover the negative tweeter terminal is also the woofer positive terminal. The woofer negative terminal is additionally at ground. Thus, no additional measurements are required for this crossover. However, if the crossover circuit was more complex measurements would generally be made at the woofer positive and negative terminals as well. As with the acoustic response data, these measurements curves are stored as *.frd and *.fr2 files for later use. The measurements for this crossover are show below. |
|
|
|
 |
|
|
|
Measured electrical response at the tweeter positive terminal (node 1 in the crossover schenatic above). |
|
|
|
|
|
 |
|
|
|
Measured electrical response at the tweeter negative terminal (node 2 in the crossover schenatic above). |
|
|
|
|
|
The next step is to determine the net electrical response of the filter section driving the tweeter. The voltage across the tweeter is the difference between the voltages at the positive and negative terminals. This is easily obtained from the above to response curvers by subtracting. This can be done using the FRC as noted above, or, in the IMP (and LAUD) this can be done directly using the merge functions. To begin, the response measured at the tweeter postitve terminal is reloaded into the IMP. Then, under the "Merge" function, the response is "pasted" above 30 Hz and "fixed". Then the response measured at the tweeter negative terminal is loaded. The phase of this response is reversed using the "shift F9" keys. Then, under "Merge" this response is "summed" to the response at the positive terminal and "fixed". The summed response is then sent "to response data" for viewing. Inverting the phase of the response measured at the negative terminal is necessary since the IMP does not allow signals to be subtracted, only summed. However, summing a signal with the phase reversed is the same as subtraction. The resulting electrical response across the tweeter terminals is shown below. This response data must also be saved. Please note that while only amplitude is shown in the figures presented here, the response at any given frequency is a vector quality (amplitude and phase) and the mathematical operation is a vector subtraction. |
|
|
|
 |
|
|
|
Net electrical response across the tweeter terminals (V1 - V2). This is the tweeter drive voltage vs frequency. |
|
|
|
|
|
The response shown above represents the amplitude transfer function of the tweeter section of the series crossover. For this filter topology, the woofer transfer function is just the voltage response measured at the tweeter negatibe (woofer positive) terminal. However, in a more complex series crossover the voltage across the woofer terminals would have to be constructed, just as was done for the tweeter, by subtracting the voltage measurements taken at the positive and negative terminals of the woofer.
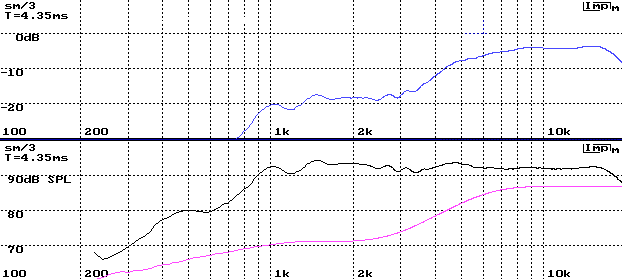
Ok. Now we have the electrical response of the crossover across the woofer and tweeter. How do we obtain the acoustic response from each driver? This is straight forward. We simply multiply the acoustic response of the driver by the electrical response (transfer function) we just created above. Again, this can be done using the FRC. However, the IMP (and LAUD) allow this to be done internally. For the tweeter, first the electrical response function (shown above) is loaded and set as the calibration curve. Then the tweeter acoustic response is loaded. Next, under the transform menu "Xfer" is clicked. This will multiply the tweeter acoustic response by what ever is stored as calibration data. Since the tweeter crossover electrical response was loaded as the calibration data, the result is the net acoustic response output by the tweeter when connected to the crossover. This is shown below where the black curve is the raw tweeter SPL response, the violet curve the the filter transfer function, and the blue curve shown above the others is the net acoustic output of the tweeter. |
|
|
|
 |
|
|
|
Net acoustic response of the tweeter (blue curve), raw tweeter response (black), and filter high pass response (violet). |
|
|
|
|
|
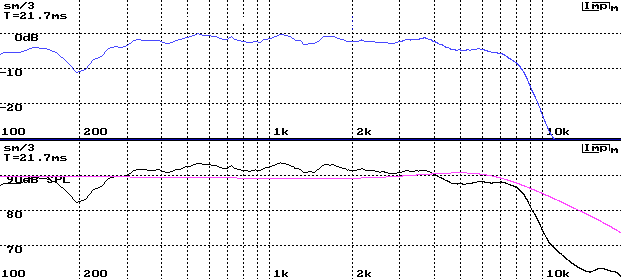
This can also be done for the woofer by loading the net electrical response across the woofer terminals as the calibraition data, loading the raw woofer SPL data, and then clicking "Xfer" under the "transfrom" menu. The result is shown below.
Finally I would like to note that based on the DC resistance of these drivers, and accounting for the attenuation resistor in the tweeter circuit, the Zeta value for this crossover is about 1.07 and the crossover frequency is 4643 Hz. Obviously, by examining the electrical (violet) and acoustic (blue) curves in the figures above and below, this is not the case either electrically or acousticly. In fact, acoustically, the woofer runs nearly full range. The tweeter shows a shelved response at about -15 dB between 1 and 3 K Hz. This becomes apparent using the technique outlined here which allows the acoustic output of each driver to be determined without interference for the other driver.
John k...
|
|
|
|
 |
|
|
|
Net acoustic response of the woofer (blue curve), raw woofer response (black), and filter low pass response (violet). |
|
|
|


