| This version reflects the comments of the core participants as reviewed and incorporated in accordance with CORD's FIPSE-supported Curriculum Morphing Project. | ||||||||||||||||||||||||||||||||||||||||||||||||||||||||||||||||||||||||||||||||||||||||||||||||||||||||||||||||||||||||||||||||||||||||
MODULE 4-9 (1) Most modern laser systems and electro-optic equipment have output signals for interfacing with other equipment and computers. Many applications, especially in the industrial setting, call for complete control of the laser system. Some commercially available lasers can be operated only via a computer because no front control panel is available. The availability, popularity, and power of personal computers have led to their increased use in laboratories, operating rooms, and factories for control of instruments and for data acquisition. The three common computer-interfacing techniques involve the use of the IEEE 488 interface, the RS-232 interface, and data-acquisition boards. IEEE 488 is widely available for the control of instruments requiring high data-transfer rates. A popular choice for simple instrument control at lower data-transfer rates is the RS-232 interface. The recent advent of low-cost converter technology for electronic signal conditioning has made the plug-in data-acquisition board a popular and widely used instrumentation method. Given the high data-transfer rates required in many modern applications, the technician must be able to control lasers and electro-optic equipment from a computer. The technician must be familiar with the hardware and software tools for all interfacing methods and have the skills to integrate all of them in a single application. Before studying this module, you should have a basic understanding of the operation of personal computer systems, familiarity with standard electro-optic instruments such as power and energy meters, and knowledge of the BASIC computer programming language. This module will cover the standard output signals from electro-optic instruments and the computer-interfacing techniques of IEEE 488, RS-232, and plug-in data-acquisition boards. 
When you complete this unit, you should be able to: 1. Using terms similar to those in the text, describe the operation and characteristics of the three most important computer-interfacing techniques. Describe typical applications for each. 2. Define the functions of the 24 channels in the IEEE 488 interface. 3. Draw a typical pin-out for an RS-232 cable. Define baud rate, parity bit, and the nature of serial communication. 4. Draw a simple analog-to-digital (A/D) converter circuit. 5. Relate the number of bits in the (A/D) converter to the accuracy of a measurement. 6. Use an RS-232 interface to vary and control the output power of a continuous laser. Interface a power meter with the computer and use the interface to collect and store the measured values of output power. 7. Using a computer and a multifunction input/output board, program the computer to provide adjustable DC voltages.
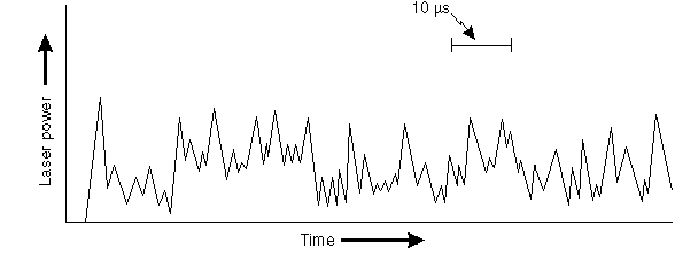
Introduction to Computer- The need to interface electro-optic systems to a computer arises when complex operations need to be collected in short periods of time or when large amounts of data need to be collected. Only a small number of years ago, data-taking in scientific, engineering, and industrial settings was largely manual, with workers reading instruments directly and writing the values. Or waveforms could be collected using chart recorders and oscilloscopes and then processed by hand. As an example, Figure 1 shows an oscilloscope trace of the pulsed oscillations typical of the structure within the pulse of many solid-state lasers. The observer would have to perform many measurements on the complex waveform by hand and then perform a numerical integration to determine the total pulse energy. This represented a laborious and time-consuming process.
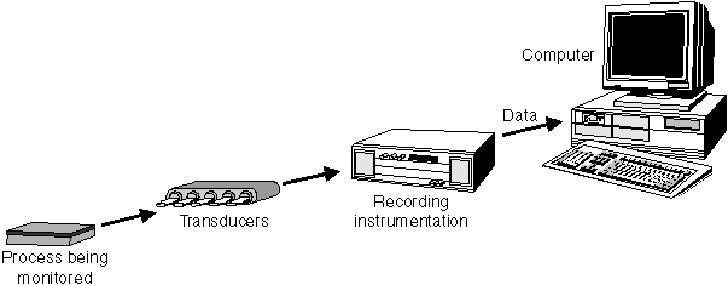
Fig. 1 If the output of the detector viewing this pulse were to be sent directly to a computer, the computer could record the waveform at high frequency and process the data rapidly and automatically, substantially reducing the labor and the time to make the measurement. This example shows the benefits of interfacing instrumentation to a computer, as compared to how data were collected previously. There are four main methods for interfacing instrumentation to computers for data acquisition or for remote operation of the instrument. An instrument may take the form of an oscilloscope, multimeter, energy meter, power meter, display, printer, chart recorder, spectroscope, or laser, or an extensive system containing a number of these components. The four basic groups of interfacing techniques are: • IEEE 488 • RS-232 • Data-acquisition plug-in boards • VXIbus. The two used most often are the IEEE 488 and RS-232 interfaces. The IEEE 488 is available for thousands of instruments from hundreds of suppliers. It is designed for remote control of programmable instruments, has data-transfer rates greater than one megabyte per second, and can simultaneously control up to 15 instruments. RS-232 is used for serial remote control of simple instruments. It is available for thousands of instruments and is built into most computers. Plug-in data acquisition takes the form of analog-to-digital (A/D) conversion, digital-to-analog (D/A) conversion, digital input/output (DIO), and counter/timer operations. These plug-in boards are actually stand-alone instruments such as an oscilloscope, multimeter, or fiber-optic power meter that are installed directly inside the computer. IEEE 488, RS-232, and plug-in data-acquisition boards will be introduced and described in this module. The VXIbus is a relatively new standard best suited for sophisticated instruments requiring very high performance. It requires extensive knowledge of computers and instrument design. It does not fit within the scope of this module. Therefore, VXIbus will not be discussed here. Computers may be used for either monitoring a process and collecting data on it, for control of a process or instrumentation, or for both monitoring and control. Figure 2 shows, in general schematic terms, the use of a computer for process monitoring. The flow of information is from the process to sensors and transducers that measure quantities such as pressure, temperature, chemical composition, voltage, current, and so on, to the computer, which accepts and stores the data in memory.
Fig. 2 For process control, the flow would be in the opposite direction, in the form of commands issued by the computer and being transmitted to the process-control instrumentation.
Electro-Optic Instrumentation Outputs A variety of different types of laser and electro-optic instrumentation may be interfaced to computers, either for control of the devices or for recording of their outputs. In this section, we briefly describe the types of output from several different types of instrumentation. This list is far from exhaustive, but is intended to present some representative types of instrumentation and their outputs, and to show the widely varying requirements that may be encountered.
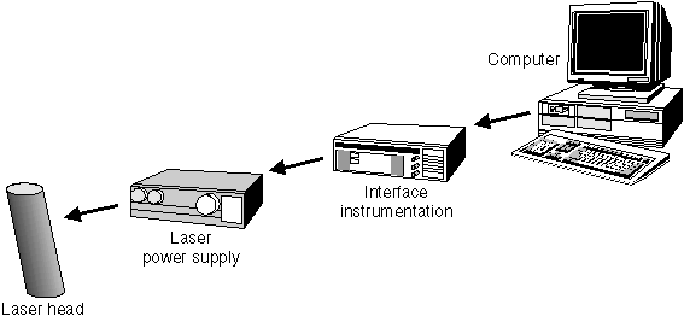
Laser Systems In laboratories, surgical rooms, and industry, there are laser systems that are totally or partially controlled by computers. These systems can be controlled through any combination of standard interfacing techniques, including IEEE 488, RS-232, analog-to-digital (A/D) converters, digital-to-analog (D/A) converters, or parallel digital interfaces. There are also varying degrees of computer control. In some systems, the computer may only check the operating parameters and shut the system down if the parameters vary outside of predetermined limits. In other systems, the computer may control all aspects of the laser operation, including light output, operating current, cooling, beam handling and interlocks, as well as monitoring the operating parameters. The laser head and power supply may not even have meters to show how the laser is operating or manual controls to adjust the laser. The level of dependency of the laser system on the computer depends on the application. In some situations there may be a need for an operator to control the laser system directly because of safety concerns. There may be a need for stand-alone operation in case of computer failure. The technician must be able to understand what is required for the different types of interfaces to function properly to effectively troubleshoot systems that are a blend of two or more technologies. Figure 3 shows a generalized block diagram depicting the flow of commands in a computer-controlled laser system.
Fig. 3
Energy Meters Energy meters incorporate detectors that generate signals proportional to the incident light intensity. They also often contain microcircuitry that can integrate the signal and derive the total energy contained in a laser pulse. There is a wide variety of different types of energy meters, some using photon detectors and some using thermal detectors. The meters have varying capabilities, some incorporating up to four different channels of detection. It is possible to derive automatically the ratios of the pulse energies in different channels. The function of an energy meter may be controlled by a computer. For example, the operation of the different channels, the use of the ratioing feature, and the setting of the measurement range for each channel may be set by external signals. Also, the output of the energy meter may be sent to the computer for further processing, for recording, or for use in controlling other devices. Energy meters can have four different types of output: pulsed analog, sample and hold analog out, IEEE 488, and RS-232. All of these outputs can be interfaced to computers. Many commercial energy meters have either IEEE 488 or RS-232 output capabilities.
Photodiodes Photodiodes, discussed in the previous module, generate voltages that are proportional to the intensity of the light falling on them. One often desires to record the output of a photodiode detector, to determine laser power or energy or pulse duration, or to monitor the stability of a repetitively pulsed laser. Photodiodes can have response times ranging from the subnanosecond regime to a few milliseconds, depending on the circuitry, the mode of operation, and the amount of bias voltage, if any. The transfer of the recorded data to a computer may thus require a communications link with very fast response.
Thermopiles Thermopiles represent another type of detector used in power meters or energy meters. A thermopile is a number of thermocouple junctions connected in series. When light energy falls on the junctions, it is absorbed and heats the junctions, thus generating a voltage that, under proper conditions, is proportional to the total energy incident on the junctions. Thermopiles have relatively slow response times, often in excess of one second. The disadvantages of thermopiles include their slow response and the fact that they tend to drift with changes in room temperature. Advantages include a relatively flat spectral response and a high threshold for laser damage. The thermopile output can be interfaced to a computer through an analog-to-digital converter. Because of the relatively slow response, the conversion rate does not need to be high and any of the three types of interfacing may be used.
Computer Interfaces We shall describe the three interfacing techniques (IEEE 488, RS-232 and data-acquisition boards) in more detail.
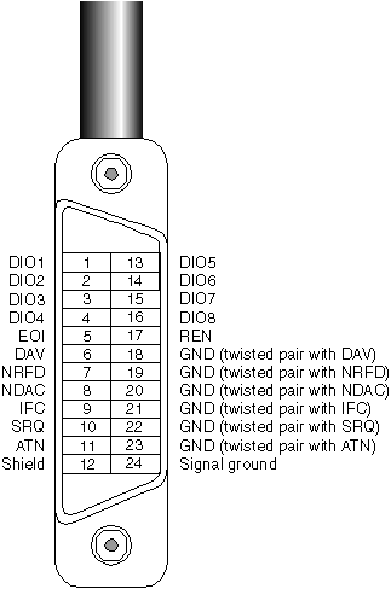
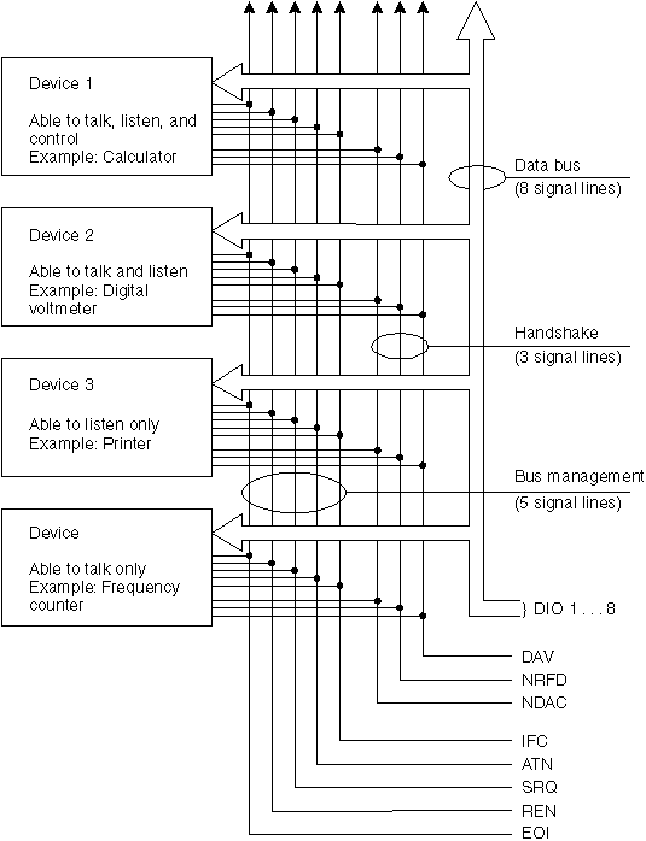
IEEE 488 Interface This interface is a parallel interface, in which data are sent simultaneously along a number of lines. This interface is called a bus. A bus is defined as a set of parallel lines used to send data or commands to several different devices. In the mid 1960s, Hewlett-Packard Co. developed a parallel interface called the Hewlett-Packard Interface Bus (HP-IB) to allow their instruments to communicate with other devices. These devices could be computers, plotters, printers, or other instruments like oscilloscopes. The HP-IB was a high-speed, parallel transfer data bus that had a throughput of one megabyte per second. The interface consisted of eight data lines and eight control lines. In 1975 the HP-IB was adopted by the Institute of Electrical and Electronics Engineers (IEEE) and was designated IEEE 488. In the 1980s the IEEE 488 was revised, adopted by the American National Standards Institute (ANSI), and designated the ANSI/IEEE 488.2-1987, commonly referred to as IEEE 488.2. In 1990, Standard Commands for Programmable Instruments (SCPI) was created by a consortium of manufacturers to define a command set that could be used by all instruments regardless of their manufacturer. The SCPI adopted and made revisions to the IEEE 488.2 command structure and made it available for many instruments. Because the IEEE 488 bus is now available for instruments and computers other than those manufactured by Hewlett-Packard, it is commonly called the General Purpose Interface Bus (GPIB). Since the IEEE 488 bus was specifically designed for instrumentation interfacing, it has some features that make it one of the better, if not the best, methods to interface instruments to computers. In the standard, devices are classified as talkers, listeners, and controllers. A talker is a device that can transmit data to other instruments. Examples include tape readers, digital voltmeters, and other measuring equipment. Listeners are devices that can receive data from other instruments or from the controller. Examples include printers, displays, and programmable power supplies. It is possible for a given device to be both a talker and a listener. The controller controls the flow of information on the bus. Essentially, the controller determines which devices talk and which listen, and in what sequence. In some systems, there may be more than one controller. But only one controller may be in charge at any given time. Connections between devices are usually accomplished using shielded 24-conductor cable with a connector at each end. The 24 pins on the connector consist of 16 signal lines and 8 ground lines. The 16 signal lines include 8 data lines, designated DI01 through DI08. These lines are used to transfer information (data and commands) between devices on the bus. The information is formatted as bytes consisting of eight bits each and is transferred one byte at a time. Three of the lines are referred to as handshake lines. These lines asynchronously control the transfer of the message bytes between devices. Five of the lines are used for general control and coordination of the bus activities. These lines are designated as interface-management lines. Table 1 defines the definition and use of each of these signals. The standard IEEE 488 connector and pin assignments are shown in Figure 4.
Fig. 4
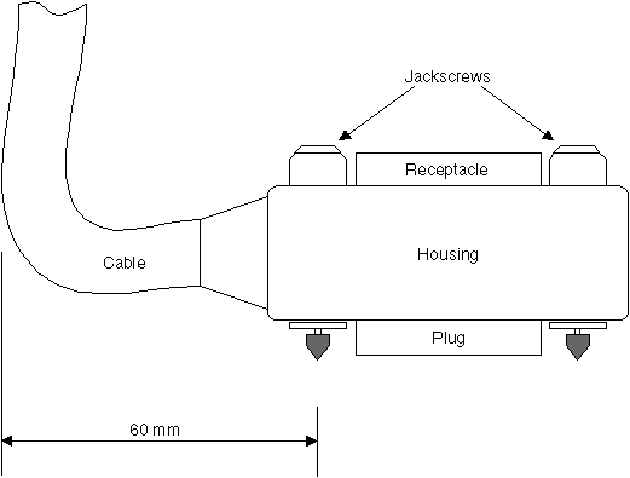
Figure 5 presents a hardware view of the connector. The connectors are attached through the use of jackscrews. The jackscrews should be hand tightened only.
Fig 5 The bus structure is shown in more detail in Figure 6. All connected devices have access to the bus lines. The data lines are used to transfer data, commands, and status information among all the devices attached to the bus. In the bus, the signal lines use low TRUE logic, i.e., a low signal voltage (less than +0.8 V) represents a logical TRUE, and a high signal voltage (more than +2 V) represents a logical FALSE.
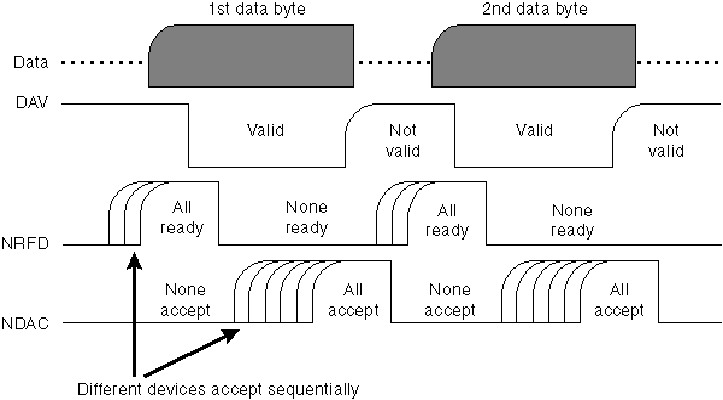
Fig. 6 In the IEEE 488 handshake protocol, which uses three lines, reliable data transfer is provided at a rate determined by the slowest listener. The devices first announce that they are ready to receive data, then the data are transferred, and finally the devices acknowledge receipt. The protocol is illustrated in Figure 7. The DAV line is controlled by a talker, the one prepared to transmit data. The talker first verifies that NDAC is low (TRUE), indicating that all the listeners have accepted the previous data. The talker then transmits a data byte and waits until NRFD is high (FALSE). This indicates that all the listeners are ready to accept data. Then the talker makes DAV low (TRUE) to indicate that the data on the bus are valid.
Fig. 7 Because the listeners have different speeds, they will assert NRFD high at different times. That is, their NRFD signals will become high at different times, as the figure indicates. The talker waits until the NRFD signals from all listeners are high. The NDAC line is used by the listeners to indicate that they have accepted the data. This is indicated by the listener asserting the NDAC high (FALSE). Again, each listener indicates acceptance of the data at its own speed. All active devices participate in the handshake protocol for each transfer of a data byte. The handshaking protocol allows many devices to receive data from a single talker. Five lines are used for bus management. The ATN line, asserted by the controller, indicates that the information on the data lines is to be interpreted as a command. The IFC line, also asserted by the controller, places the other devices in a quiescent state, neither active talkers nor active listeners. It is basically a reset of the bus. The REN line, also asserted by the controller, can place other devices in remote operation, in which a device is controlled by the controller, rather than by its panel controls. The EOI line, used by any device transmitting data or commands, is used to identify the last byte of a multibyte transmission. The SRQ line, used by any device that desires the attention of the controller, may be used to notify the controller that the device has data to send or that it has an error condition. To operate an IEEE 488 control system, an interface card and a software driver must be installed in the computer system. Several manufacturers specialize in building IEEE 488 cards for several different computer platforms. Most manufacturers offer converters that adapt other interface protocols to IEEE 488, for systems for which IEEE 488 cards are not available or that don’t have room for the cards. Depending on the software used on the computer system, a library may have to be included to compile and run software that uses the IEEE 488 driver. Examples would be C, PASCAL or BASIC compilers. Other specialized data-acquisition software packages have their own libraries built in. Normally the driver and library come with the IEEE 488 card, or, in the case of specialized data-acquisition software, the software company will specify which IEEE 488 cards will work with their software. Programs may be written that control instrumentation through the IEEE 488 bus only after the software and driver specifications have been appropriately matched. The following steps are typically followed for control of instruments over an IEEE 488 bus. 1. Initialize the instrument. This includes setting the address, secondary address, and so on. 2. Initialize the IEEE 488 controller (usually the IEEE 488 card). 3. Open the instrument for input and/or output. 4. Send any commands necessary to set up the instrument to perform its task. 5. Close the instrument after the program has finished its control loop. (This step may not always be necessary.) To summarize the capabilities of the IEEE 488 bus, we note that up to 15 instruments may be connected to one bus. The total bus length may be up to 20 meters, but the distance between two devices should be no more than 2 meters. The communication takes the form of parallel transmission of 8 bits at a time, and data rates may be up to 1 megabyte per second.
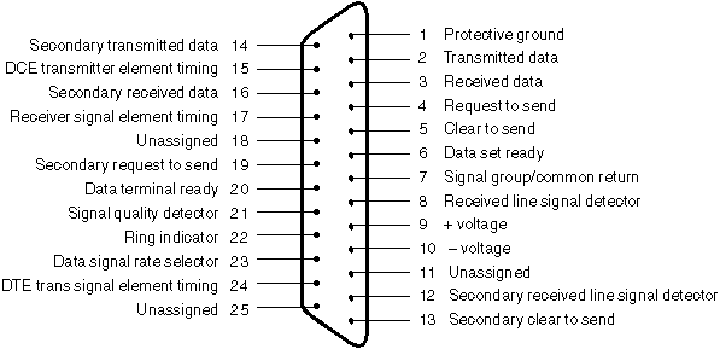
RS-232 Interface In contrast to the IEEE 488, which uses several lines to transmit data simultaneously, the RS-232 is a serial communication interface in which the data bits are transmitted sequentially. Serial communication is one of the most popular ways for computers to communicate with peripheral devices. Because of this fact, almost every computer has at least one serial port. The most popular type of serial port is an RS-232 interface. We shall briefly discuss the RS-422 and RS-423. The more popular of these is the RS-422. RS-423 is rare, but deserves mentioning. We will first discuss RS-232 and then relate the other two standards to RS-232. An important characteristic of a serial communication system is its baud rate. The baud rate is the rate at which data bits are shifted into or out of serial devices. The baud rate is defined as the reciprocal of the time to transfer one bit. If it takes 1.667 milliseconds to transfer one bit, the bit transfer rate is 600 bits per second. This is referred to as 600 baud. Commonly employed baud rates for serial devices are 300, 600, 1200, 2400, 9600, and 19,200. One reason for the popularity of serial communication is the fact that it can be used over greater distances than parallel communication. Another reason is that the interconnecting cabling is simple compared to parallel interfaces such as IEEE 488, which require eight or more data lines and several handshaking lines. In addition, serial communication has the advantage of being generally more immune to radio-frequency and instrument noise than parallel interfaces. Because of the popularity of serial communication, many instrument manufacturers offer an RS-232 interface as a standard option or as an inexpensive add-on option with their microprocessor-based instrumentation. A few manufacturers offer RS-422 or RS-423 interfaces with their instrumentation. The RS-422 and RS-423 interfaces may be used by an instrument that must transmit larger amounts of data at a faster rate than can be accomplished by RS-232. One limitation of serial communications is that the computer can communicate with only one device through a single port. To communicate with more than one device, one must use a computer with more than one serial port or use a multiplexing device The RS-232 standard specifies 25 pins for data terminal equipment (DTE) and data communication equipment (DCE), but does not specify a standard connector. A 25-pin subminiature D-shell connector is usually used when a 25-pin connector is employed. Figure 8 shows a commonly employed connector structure. There is also a popular variation that makes use of a 9-pin subminiature connector. The 9-pin variation was made popular by the IBM PC AT-style computer. Table 2 gives the pin number and function for a 25-pin subminiature D-shell connector, and Table 3 shows pin numbers and functions for a 9-pin connector. The most basic RS-232 cable uses only the receive data, R×D (pin 3); transmit data, T×D (pin 2); and signal ground, GND (pin 7) pins.
Fig. 8
Data are transmitted from the transmit pin to the receive pin. The data format consists of a start bit, data bits, possibly parity bits, and one or more stop bits. The baud rate is the rate at which these bits are transmitted. The transmission begins with a start bit, an initial bit that alerts the receiver. When the data link is idle, it is held in a logical one state. The start bit is then a logical zero. The data are transmitted as a series of data bits, organized as bytes of five to eight bits. A byte may also contain a parity bit. The parity bit is used for error detection. In one common scheme, a byte should contain an even number of ones. If the data string contains an even number of ones, the parity bit is set to zero; otherwise it is set to one. At the receiver, the parity bit is checked against the rest of the data in the byte. If an error is discovered, the data are rejected. The parity bit can detect only single bit errors. If two bits are in error, the data will appear to be valid. RS-232 communication is commonly encoded in the American Standard Code for Information Interchange (ASCII). The ASCII standard allows the encoding of information in a human readable form, i.e., as alphanumeric textual material. The code uses seven bits per character so that 27 = 128 characters are available. This allows transmission of 26 lower-case letters, 26 upper-case letters and ten numbers, plus punctuation marks and control characters such as carriage returns and line feeds. A technician should be able to construct an RS-232 cable and troubleshoot handshaking problems. This may include use of a breakout box, which is a device that allows the user to monitor the states of various pins in the RS-232 interface. Often, a null modem cable will have to be constructed to allow two DTE devices to be connected together. In summary, the RS-232 interface is a serial communication link, in which the bits are transmitted in a stream one at a time. It is useful over longer distances between instruments than the IEEE 488, but has lower bit-transfer rates, less than one kilobyte per second.
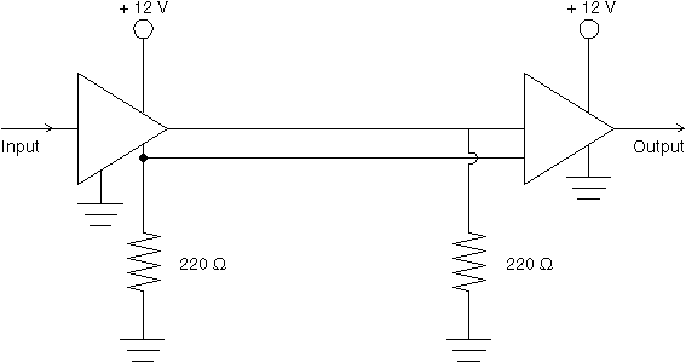
RS-422 and 423 Standards At its maximum data rate, around 20,000 baud, the RS-232 interface can transmit data reliably over distances no greater than about 50 feet. This limitation occurs because the RS-232 interface uses an open signal line with a single common ground. If one desires to transmit over distances greater than 50 feet, the baud rate must be reduced. This limitation may be reduced by use of the RS-422 interface. This interface sends each signal differentially over two adjacent wires in a ribbon cable (Figure 9). The signal received is the difference in the voltage of the two wires. The differential lines are terminated by resistors and act as transmission lines rather than simple open wires. In addition if any common mode noise is present, it will affect the two differential lines equally and will not be detected by the differential receiver.
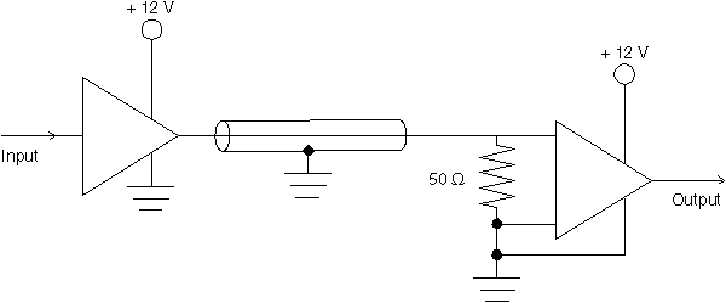
Fig 9 Use of this standard allows transmission at data rates up to 10 megabaud at distances up to 50 feet, or up to 100,000 baud at distances up to 4000 feet. The RS-422 standard is useful for replacing the RS-232 if the data rate is higher than RS-232 will support, if the distance between devices is larger than RS-232 specifications, or if noise sources may cause errors if RS-232 is used. The RS-423 standard uses a low-impedance single-ended signal, as illustrated in Figure 10. The signal is sent over 50-ohm coaxial cable. The cable is terminated at the receiver to eliminate reflections. This configuration improves electrical characteristics of the link and also allows transmission at higher data rates and over longer distances than RS-232.
Fig 10
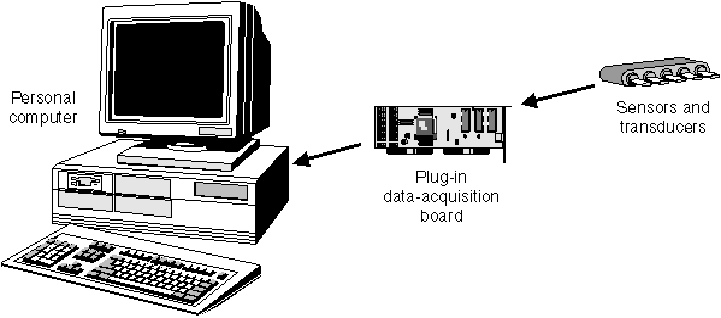
Data-Acquisition Boards Data-acquisition boards are specialized boards that may be plugged into a computer for the purpose of collecting signals from sensors, transducers, and test probes. The signals are input to the computer through the data-acquisition boards for processing. The boards are usually analog-to-digital (A/D) converters or digital input/output (DIO) boards. They also may have the function of generating control signals for the peripheral equipment. Research laboratories, industrial laser processing, medical laser surgery and test-and-measurement applications all use personal computers (PCs). A variety of different makes and models of PC is employed. The particular computer used in the application will determine the maximum processing speed of the data-acquisition system. If an industrial laser process is being controlled to include operation of motor-controlled stages, power measurements and focus control, the computer will probably have to be a high-speed 32-bit processor with coprocessor, such as an IBM AT 80486 or compatible. On the other hand, if the voltage output of a PIN photodiode is being monitored at 10 Hz, a low-end PC such as the IBM XT will suffice. Figure 11 shows schematically the generation of a signal by a sensor and the transfer of the signal to the computer through a data-acquisition board. Transducers sense physical phenomena and generate signals that the data-acquisition board can accept. For example, sensors like thermocouples or thermistors convert temperature into an analog electrical signal that the data-acquisition board can accept. The data-acquisition board acquires the data and transfers them into and out of the computer memory. It can increase the capability of the computer to handle data by using programmed hardware to transfer data directly into the memory. This frees the processor for other tasks.
Fig 11 Plug-in boards are available for most computer types. The boards have varying combinations of inputs and outputs, including analog, digital, and timing. Many boards offer programmable channel sampling and conversion. Thus, such boards offer versatile solutions for data-acquisition applications. A data-acquisition board can function as a very versatile instrument and process controller. Boards for IBM PC/XT/AT and compatible computers are capable of sample rates up to 1 MHz, with 16 bits of resolution, 64 analog input channels, 10 analog output channels, 96 digital input/output (I/O) channels, and 10 counter/timer I/O channels. A single board is not capable of all these specifications simultaneously, but boards can be used in combination to achieve all the capabilities listed above. One must make tradeoffs to suit specific applications. For example, the National Instruments AT-MIO-16X data-acquisition board has a maximum sampling rate of 100 kHz, 16-bit resolution, 16 single-ended or 8 differential analog input channels, 2 analog output channels, 8 digital I/O channels, and 3 counter/timer I/O channels. Another board, such as the National Instruments PC-DIO-96, contains only 96 digital I/O channels for process control. Similar capabilities are available for Apple Macintosh data-acquisition boards. They offer 1-MHz sampling rates, 16-bit input resolution, and six 12-bit analog output channels. Many power and energy meters and other types of optical instrumentation have some form of analog output. The output is available for interfacing the instruments to devices such as oscilloscopes, chart recorders, and multimeters. The output can also be used to interface the instruments to computers with the use of an analog-to-digital (A/D) converter. This gives the operator of the equipment one more avenue to help collect data in a reliable and timely manner. A/D converter boards are available for almost every type of computer. Other uses for A/D converters include the direct interface of detectors and sensors to a computer without use of other expensive instrumentation. This fact adds more flexibility to the way data may be processed. Data-acquisition boards are also used when manufacturers integrate laser and electro-optic systems into industrial and medical equipment. In this section, we will discuss some of the popular A/D converter types, some sample interfaces, input signal conditioning, and definition of input parameters.
A/D Converters Three types of A/D converters are in wide use today. The most widely used is the successive approximation converter. This converter offers a good cost-to-performance tradeoff. The second type of A/D converter is the slope converter, for which there are three basic configurations: • Single-slope converter • Dual-slope converter • Voltage-to-frequency converter Of these, we shall discuss only the dual-slope converter in detail. The slope converters are inexpensive, but are slow in comparison to the other types of converters. The last type of converter is the flash converter. This type is very fast, but is also the most expensive.
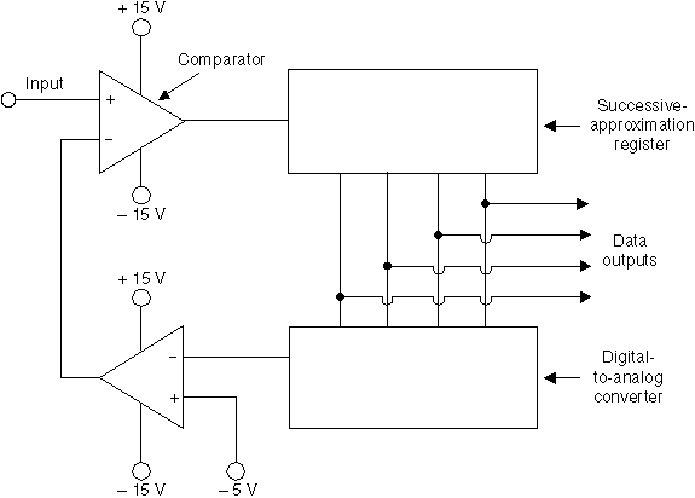
Successive Approximation Converters These converters employ operational amplifiers (op amps) and make use of the capability of op amps to act as comparators. An op amp has two signal inputs. The op amp amplifies the difference in these two signals by a large factor, up to 105. The inputs are denoted with plus and minus signs. The input with the minus sign is called the inverting input and the one with the plus sign is called the noninverting input. These signs indicate the direction in which the output signal will move in response to that input. If the noninverting input is more positive than the inverting input, the output will move in a positive direction, and conversely. If the inverting input is held at a fixed reference voltage and an input is applied to the noninverting input, the output will move in a positive direction if the input is more positive than the reference voltage. The output will move in a negative direction if the input is less positive than the reference voltage. Thus, the op amp essentially compares the input and reference voltages and gives an indication showing which is more positive. The successive-approximation converter compares the input voltage to voltages generated by a successive-approximation register in a series of comparison steps. A simplified block diagram of the circuitry for a four-bit device is shown in Figure 12 for a 4-bit converter. The input voltage is applied to the noninverting gate of a comparator. The successive-approximation register generates a series of bits, starting with the most significant and ending with the least significant. The first bit is sent to the digital-to-analog converter and an amplifier, which converts it to a voltage that is then applied to the inverting input of the comparator. If this voltage is higher than the input voltage, it will drive the comparator output negative. The negative output is sent to the successive-approximation register, which then turns off that bit. If the voltage at the inverting input of the comparator is lower than the input, the comparator output will move positive. This input to the successive-approximation register will allow the bit to remain on.
Fig. 12 This procedure is repeated in steps with all the bits from the successive-approximation register. At the end of four steps, the series of bits on the output lines is a digital representation of the original input voltage. Successive-approximation A/D converters are available as single chips. Twelve-bit successive-approximation converters are available with conversion times in the microsecond region.
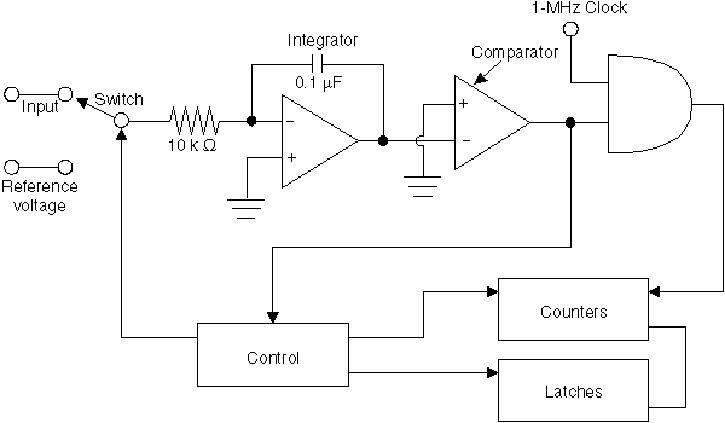
Dual-Slope Converters The dual-slope converter can provide a high resolution inexpensively. Thus it is sometimes used in digital voltmeters. Figure 13 shows a block diagram for a dual-slope converter. With all counters set to zero and the input voltage (assumed positive) applied to the integrator portion of the circuit, the output of the integrator will be driven negative. The slope of the output ramp will be greater when the input voltage is higher. After some time, the output voltage will pass through zero in its negative ramp. The time will be shorter when the input voltage is higher. When the voltage from the integrator drops below zero, the output of the comparator will become high. This enables the AND gate and allows the 1-MHz clock signal to reach the counters. The counters are allowed to count for a predetermined length of time. Then the controller connects the integrator through a switch to a fixed negative voltage and resets the counters to zero. This causes the output of the integrator to ramp positive. After some time, the output of the integrator will pass through zero in its positive ramp. This will drive the output of the comparator low and will isolate the clock signal from the counters. The length of time for the integrator output to return to zero is proportional to the input voltage. Thus the number of counts registered gives a measure of the input voltage.
Fig. 13 Dual-slope converters are available as single chips with high resolution. The resolution is commonly specified in terms of digits, because the converters are frequently used with displays and with digital voltmeters. A single chip may offer three to four digits of resolution, corresponding to a resolution around one part in 2000. The main drawback of dual-slope converters is their relatively slow speed, which may be as long as several hundred milliseconds to perform a conversion. Although relatively simple and less costly than the successive-approximation converters, they are much slower.
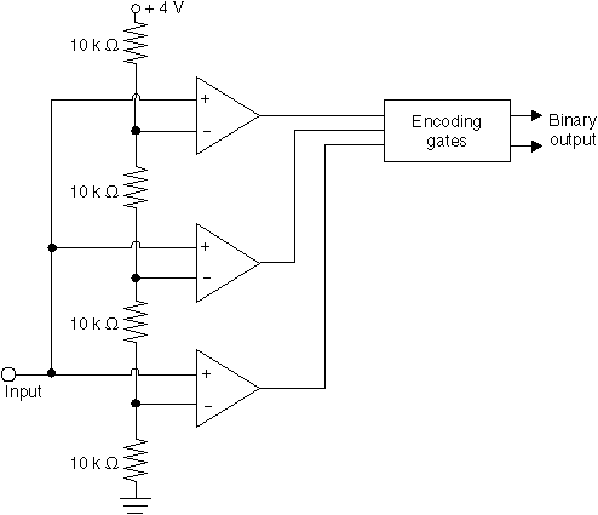
Flash Converters The flash converter, also called a parallel-comparator converter, uses voltage dividers to set reference voltages on the op amps used as comparators. Figure 14 shows a circuit for a two-bit device. The resistor chain sets the voltages at the inverting inputs of the op amps. From top to bottom, the reference voltages are 3 V, 2 V, and 1 V. The signal is applied to the noninverting inputs. The outputs will go high for the op amps for which the input signal is larger than the reference voltage at the inverting input. Thus, the outputs of the three comparators give a representation of the value of the input signal. For the example given, output of the two lowest op amps will be high if the input lies between two and three volts, and the output of the top op amp will be low.
Fig. 14 In this example, for 2-bit conversion, one requires three comparators. To obtain higher resolution, one must use more comparators. To obtain a resolution of n bits, one must use (2n – 1) comparators. For 8-bit resolution, one would need 255 comparators. Thus flash converters become expensive. This is the most important drawback to their use. Because the input signal is applied in parallel to all the comparators, the conversion is rapid. Their high speed is the main advantage of flash comparators; it in fact leads to their name. Some 8-bit comparators that perform an A/D conversion in 20 nanoseconds are available. Of the three types of converters described here, the flash converter is the fastest, but the most costly.
Input Signal Conditioning Signal conditioning may be necessary to take the signals generated by transducers sensing temperature, pressure, and so on, and make them suitable for input to a data-acquisition board. Signal conditioning can include amplification of the signal, isolation, and filtering. Signals with small amplitude may need to be amplified to reduce noise and increase resolution. The signal should be large enough so that the maximum voltage is equal to the maximum input of the board. Isolation of the input signal from the computer may be desirable, especially if the signal might contain high transient voltages that could damage the computer. An important consideration is protection of the A/D converter board and the computer from voltage spikes and surges that could damage them. Filtering may be useful to remove noise from the signal. Low-pass filters can remove high-frequency noise transients before the signals are processed by the data-acquisition board It may also be necessary to filter the signal when the environment is noisy. Input-signal conditioning often comes standard with data-acquisition boards. It may consist of a series of selectable gain stages and offset adjustments. At other times, the signal may have to be attenuated or terminated into a predetermined load. Some signals may have a large offset that cannot be removed with the adjustments on the A/D converter board. Manufacturers of data-acquisition boards offer modules for amplification, isolation, filtering, and other functions.
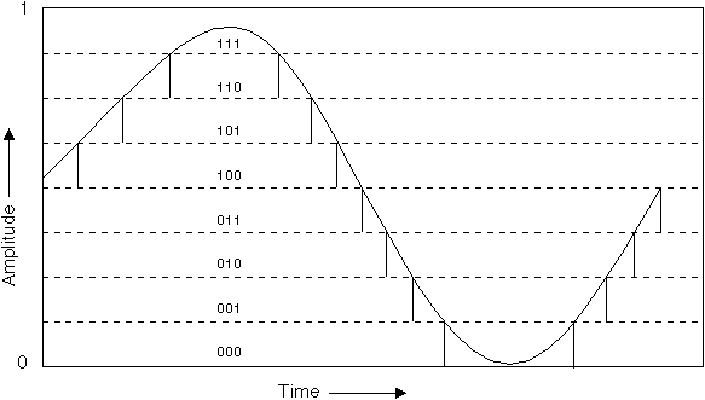
Defining Input Parameters The parameters of the signal from the device being interfaced must be evaluated before using the data-acquisition board. This evaluation should include measuring the parameters with other instruments. Preferably the signal should be monitored with an oscilloscope. The use of an oscilloscope can determine if there are noise, voltage spikes or other conditions that might cause erroneous measurement, or damage to the computer or the A/D converter board. Use of an oscilloscope will also determine the maximum and minimum signal levels. After input-signal parameters are known, the specifications of the A/D converter should be consulted to determine if additional signal conditioning must be performed. If the signal is noisy, it may be necessary to filter the signal to ensure proper measurement. However, one must be careful not to degrade the signal by overfiltering it. The maximum frequency or the maximum transition speed required for the measurement must be considered when defining input-signal parameters. This is important because all A/D converters are limited by their conversion time. This determines the maximum sample frequency. The conversion time is the time it takes the A/D converter to determine the value of the signal. If the conversion time is too long, the sampling rate will be low. A fast sampling rate is desirable because one can acquire more points per unit time and can obtain a better representation of the signal. To characterize a signal, there should be at least two samples per cycle of the highest-frequency component present in the signal. This is a statement of the sampling theorem (Nyquist criterion) which states that the sampling rate must be twice the highest-frequency component. In practice, the sampling rate will typically be five to ten times the highest-frequency component. The accuracy of the signal measurement will increase as the number of sampling points per cycle increases. The number of bits an A/D converter uses to represent an analog signal is referred to as the resolution. As the number of bits increases, the analog signal is separated into a larger number of finer divisions. This leads to the ability to detect smaller changes in the incoming signal. The number of discrete levels is determined by raising 2 to the power equal to the number of bits. An 8-bit A/D converter has 28 or 256 divisions, represented in binary code as 0000 0000 to 1111 1111. Accordingly, a 12-bit converter has 4096 levels and a 16-bit converter has 65,536 levels. Most manufacturers specify their resolution in bits or percent full scale. The formula for determining percent full scale is: (1/2N) ´ 100 where N is the number of bits. For 8-bit resolution, the percent full scale is: (1/28) ´ 100 = (1/256) ´ 100 = 0.39% Figure 15 shows a simple example, in the form of a sine wave and its digital form as obtained by a 3-bit A/D converter. The curve is approximated by 23 = 8 levels, which are denoted by a binary code between 000 and 111. A converter with only three bits does not give an accurate representation of the sine wave, but is useful as an example. As the number of bits increases and the number of discrete levels that are used to approximate the signal becomes large, the approximation can become very accurate.
Fig. 15 In summary, the use of plug-in data-acquisition boards represents a very rapidly growing alternative to computer interfacing of instrumentation. They transfer data directly to and from computer memory. They combine low cost with moderate performance. Commonly available units offer 8- to 16-bit conversion and data rates up to 1 MHz.
Continuous laser with RS-232 control interface (Coherent INNOVA 400 argon laser or equivalent) Computer (IBM AT or XT or equivalent) Serial-port multiplex board (if required—IOtech COM232/2AT or equivalent) Power meter (Scientech AC 5001 or equivalent with RS-232 interface) Multifunction I/O board (Analog Devices RTI205 or equivalent) Computer (IBM PS-2 or equivalent) Digital multimeter Cables and connectors as required
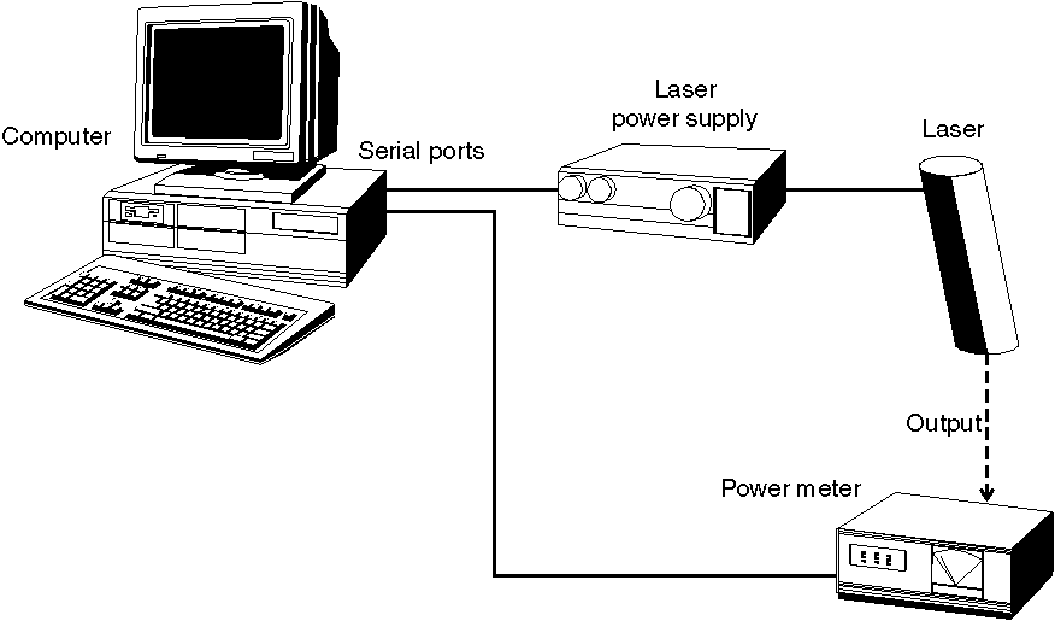
In these procedures you will interface a laser with a computer over an RS-232 interface and control the output of the laser. You will also program a computer to provide stepwise adjustment of a DC voltage using a computer and a multifunction I/O board. The list of materials indicates certain manufacturers’ equipment. This is not intended as an endorsement of those manufacturers. The equipment is chosen because it has suitable interfaces and to be specific with the procedures. Other manufacturers have equipment that is suitable. The procedures will have to be modified if other equipment is used. In the first portion of the procedures, you will interface an argon laser to a computer and control and measure the output power. Assemble the equipment as shown in Figure 16.
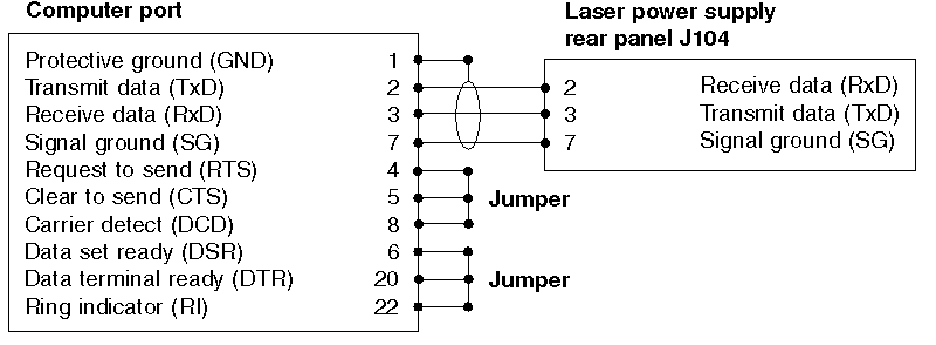
Fig. 16 Details of the connection from the computer to the laser power supply are shown in Figure 17 for the INNOVA 400 argon laser. The connection is to the J104 connector on the rear panel of the power supply. This connector is configured with only three pins connected (R×D, T×D, and SG). One should use jumpers on other pins of the computer terminal as indicated.
Fig. 17 If a different laser is used, these provisions will have to be modified. If the computer is an IBM XT or compatible, use a serial printer cable. If an IBM AT or compatible is used, use a modem cable. Connect the power meter via its RS-232 connector, according to the manufacturer’s instructions. Turn on the laser. Set the following initial conditions according to the laser manufacturer’s instructions: • Baud rate • Parity • Number of data bits Instructions sent to the computer consist of commands written as a string of ASCII characters followed by a carriage return. Responses to queries are also given as strings of ASCII characters. When the system has executed a command, it will return a carriage return and line feed as an indication. Some of the commands available for the INNOVA 400 are given in Table 4. The available commands will vary from one laser to another.
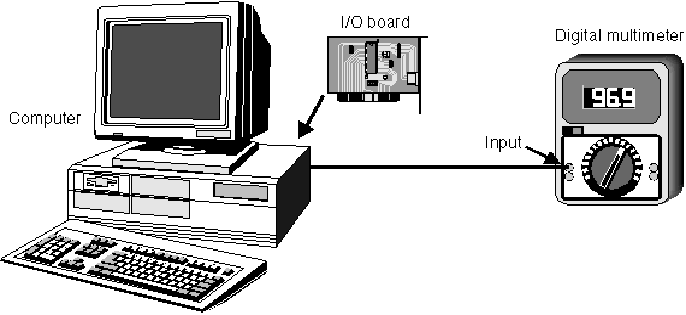
Using the computer keyboard, control the operation of the laser. Turn the laser on and off. Adjust the wavelength to several different visible lines and observe the changes in color. At one set wavelength (488 nm), vary the laser output power. Observe the changes on the power meter. Send the values of the power-meter reading to be stored in the computer. Display the results on the computer display and compare them to the requested values. In the second portion of the procedures, you will program a computer to adjust an output voltage from a multifunction I/O board from –10 volts to +10 volts. The equipment should be set up as shown in Figure 18. The output is from the I/O board, which is inserted in the computer. The connection should be made to the multimeter via ribbon cable.
Fig. 18 Program the computer using the following BASIC program. If types of equipment other than those given in the equipment list are used, the program may have to be modified.
Program for Adjustable Voltage 1 DEFINT A-Z 5 REM PROGRAM TO OUTPUT ANALOG VOLTAGE 10 DEF SEG = &HEF2: REM HEX ADDRESS RETURNED 15 REM OFFSETS FOR ROUTINE ARE NEXT 20 INITIALIZE = 0: AOT205 = 183: AOT = 21 25 CALL INITIALIZE (ERSTAT) 30 IF ERSTAT = 0 GO TO 45 35 PRINT "INITIALIZE ERROR:",ERSTAT 40 STOP 45 LCHAN =1:SLOT = 3 50 PCHAN = 0:DATATYPE = 0 55 CALL AOT 205 (LCHAN,SLOT,PCHAN,DATATYPE,ERSTAT) 60 IF ERSTAT = 0 GO TO 75 65 PRINT "SETUP ERROR:",ERSTAT 70 STOP 75 INPUT "NEW SETPOINT ="'SETPT 80 CALL AOT (LCHAN,SETPT,ERSTAT) 85 IF ERSTAT = 0 GO TO 100 90 PRINT PERFORMANCE ERROR:",ERSTAT 95 STOP 100 END This program will adjust the output voltage from –10 volts to +10 volts in steps. There are 4096 steps, so the adjustment will be about 4.88 millivolts per step. Run the program and observe the output of the digital multimeter to verify the operation.
The purpose of these procedures is to gain familiarity with the automated control and readout of instrumentation. Therefore, a data sheet is not appropriate.
1. Using terms similar to those in the text, describe the operation and characteristics of the three most important computer interfacing techniques. Describe typical applications for each. 2. Define the functions of the 24 channels in the IEEE 488 interface. 3. Draw a typical pin-out for an RS-232 cable. Define baud rate, parity bit, and the nature of serial communication. 4. Draw a simple analog-to-digital (A/D) converter circuit. 5. What will be the resolution (in terms of full scale percent) for a 12-bit A/D converter? 
Hall, D. V. Microprocessors and Interfacing: Programming and Hardware. New York: McGraw-Hill, 1986. IEEE 488 and VXIbus Control, Data Acquisition and Analysis. Austin, Texas: National Instruments Corp., 1993. Instrument Communication Handbook. Cleveland, Ohio: IOtech, Inc., 1991. |
||||||||||||||||||||||||||||||||||||||||||||||||||||||||||||||||||||||||||||||||||||||||||||||||||||||||||||||||||||||||||||||||||||||||

