
by D. A. Robinson, J. P. Bell, and C. H. Batchelor
Institute of Hydrology, Maclean Building, Crowmarch Gifford Wallingford, Oxfordshire,
England
Time domain reflectometry (TDR) has become a standard approach for measuring soil water content in recent years. One factor that dielectric soil moisture determining techniques have in common is the need for calibration. Early work in this field suggested soil type independent calibration, this has since been shown to be an over simplifications with more recent work recommending in situ calibration. Results presented from a series of experiments show the influence of some iron and titanium oxide minerals on the determination of dielectric constant by TDR and the subsequent estimation of water content. Magnetite showing the greatest effect by causing an over estimation of water content of up to 60% using a standard calibration in the presence of 15% magnetite. Hematite, rutile, and ilmenite were also observed to influence the measurement of dielectric constant using the TDR technique. Further research is recommended on the influence of soil mineralogy on TDR calibration.
Moisture content has long been known to influence the dielectric constant of soil. Due to large relative difference in the dielectric constant of water (80), air (1) and soil minerals (4) TDR and the capacitance probe can be used to estimate soil water content. The commercial availability of such techniques gives relatively easy access to rapid data acquisition, which is non radioactive and non destructive. Laboratory calibration data is becoming widely available in the literature, (Topp et al., 1992; Dirksen & Dasberg, 1993; and Jacobsen & Schjonning, 1993) but work is still required to improve understanding of the effects of a variety of soil components on these calibrations. It is becoming clear that a single calibration is not satisfactory at present. Topp et al. (1980) and Roth et al. (1992) have shown that different TDR calibrations are required for mineral and organic soils. The results presented here show the influence of the iron minerals magnetite, hematite and goethite, and the titanium minerals rutile and ilmenite on TDR calibration.
Iron materials in a variety of different forms occur in a large proportion of soils worldwide. The more well known iron minerals in soil are, goethite, hematite, ferrihydrite, lepidocrocite, magnetite, and maghemite. The most abundant of which are goethite and hematite which may occur in large quantities in Oxisols, Ultisols, Alfisols, and Inceptisols. Their large presence in Oxisols and Ultisols has led to the creation of ferritic and oxidic families within the USDA Soil Taxonomy, (Soil Survey Staff, 1975).
The occurrence of titanium minerals in soils is generally minor. Estimations of amounts vary; the majority of soils worldwide contain < 1% titanium. This is usually in the form of anatase, brookite, rutile, ilmenite, or sphene. Quantities of up to 25% (TiO2) have been reported for certain size fractions from Hawaiian soils (Sherman, 1952). Significant quantities have also been reported in the A horizons of peaty Podzols from Ireland and Scotland (Bain, 1976).
Natural samples of rock in the form of magnetite (Fe3O4), Hematite
(![]() -Fe2O3), goethite (
-Fe2O3), goethite (![]() -FeOOH),
rutile (TiO2), and ilmenite (FeTiO3) were crushed into a fine powder
and added to a fine silica sand matrix (< 0.2 mm) to form mixtures of mineral and sand. Mixtures
were made up containing 5%, 10%, and 15% by mass for each of the iron minerals, rutile had in
addition a 20% mixture; the ilmenite had only a 10% mixture. Columns constructed from PVC
pipe 0.102 m internal diameter and 0.30 height were used to contain the samples. Measurements
were taken on dry and saturated mixtures using the procedure described by Robinson et
al., (1994).
-FeOOH),
rutile (TiO2), and ilmenite (FeTiO3) were crushed into a fine powder
and added to a fine silica sand matrix (< 0.2 mm) to form mixtures of mineral and sand. Mixtures
were made up containing 5%, 10%, and 15% by mass for each of the iron minerals, rutile had in
addition a 20% mixture; the ilmenite had only a 10% mixture. Columns constructed from PVC
pipe 0.102 m internal diameter and 0.30 height were used to contain the samples. Measurements
were taken on dry and saturated mixtures using the procedure described by Robinson et
al., (1994).
The mineral samples were analyzed by X-ray diffraction. The goethite sample was almost a pure with less than 1% quartz. The hematite contained 29% quartz where as the magnetite contained 5% quartz, 18% chlorite, and 15% stilpnomelane. The rutile and ilmenite were both more than 95% pure.
The TDR system used in the study was the Trase System 1 (Soil Moisture Equipment Corps, USA). The design and operation of TDR equipment, in general, is described by Topp et al. (1980) and of this equipment, in particular, by Anon (1990). The interpretation of the time domain waveform is fundamental to the calculation of apparent dielectric constant, Ka. Once Ka has been determined, the water content is calculated using the Trase TDR calibration (Anon, 1990) which is similar to that of Topp et al. (1980).
In the experiments reported here 0.2 m unbalanced three wire probes were used with 1 m cable length. Care was taken to ensure that no air entrapment occurred during the saturation of the columns. This was achieved by wetting up from the base of the column.
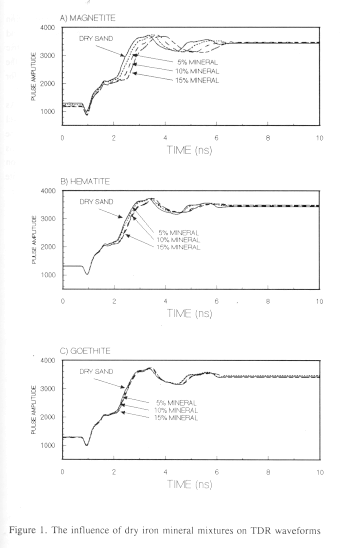
Influence of minerals on TDR response in dry sand and mineral mixtures
The waveforms produced by the TDR in response to different mixtures of minerals in dry sand are shown in FIGURE 1. Magnetite had the greatest influence as it increased in proportion. This is evidenced by the increased travel time of the reflection as the magnetite proportion increased. Manual interpretation showed that the travel time increased from 1 ns in dry sand to 1.5 ns with a 15% proportion of magnetite. This corresponded to an increase in dielectric constant of 2.5. The hematite showed a similar response in that the waveform moved to the right with the increased proportion of mineral, but to a far lesser extent than that for magnetite. The goethite had no effect on increasing the travel time of the pulse (FIGURE 1C).
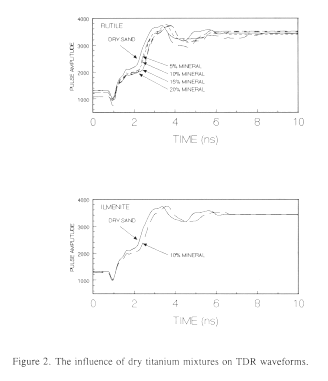
The influence of the titanium minerals in the TDR waveforms is shown in FIGURE 2. As with the presence of magnetite and hematite, the rutile and ilmenite both increase the travel time of the reflected pulse. Unlike the response to magnetite the increase in travel time in the rutile mixture was found to be very dependant on the orientation of the waveguide. This influence is very important as the dielectric constant determined was very dependant on spacial distribution and the orientation of the mineral fraction with the waveguide. Ilmenite appears to cause much the same response as the rutile increasing the travel time of the pulse.
TDR response in saturated sand and mineral mixtures
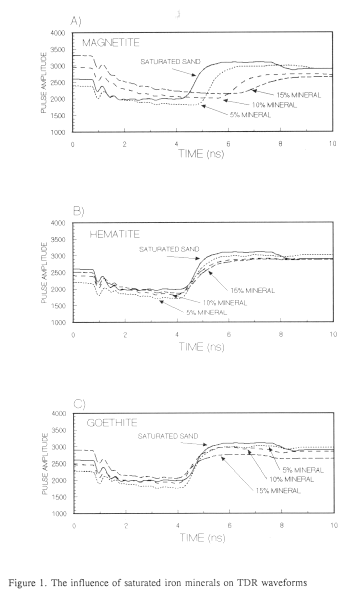
The TDR waveforms produced from the saturated iron mineral mixtures are shown in FIGURE 3. In theory, the waveforms should have reduced in travel
time and moved to the left indicating the reduced volume of water due to the reduced water
content within the column. This was not the case in the presence of magnetite (FIGURE 3A). The waveforms very substantially increase in travel
time and the magnitude of the reflected signal dramatically decreases. The influence of 15%
magnetite increases the Ka to 70 from saturated sand which was about 23. In comparison the
hematite and goethite did not have such a marked effect. The magnitude of the reflected signal is
decreased, most substantially for the goethite. This does not however dramatically increase the
travel time of the waves and hence the dielectric constant measured. The dielectric constant
measured in the hematite mix increased marginally. It would appear that the hematite
compensates for the reduced water content in keeping the Ka about of the mixture the same as for
saturated sand at a higher water content, rather than allowing it to decline as one would expect
when the water content is reduced. The sand goethite mix follows the decrease in water content
with reduced travel time of the wave as the proportion of the goethite increases and water content
reduces.
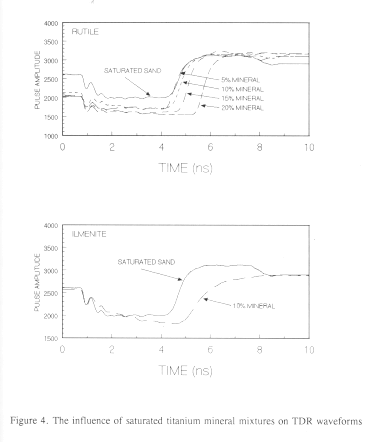
Rutile and ilmenite exerted a substantial influence on the response of the TDR (FIGURE 4). An examination of the waveforms clearly shows an
increase in the travel times of the pulses in the presence of both of the minerals. It is interesting
to note the apparent increased strength of reflection in the waves generated in the presence of
rutile. The end points tend towards becoming more abrupt, (i.e., the reflection off the end
of the guides is much sharper). The ilmenite creates a different waveform with a poor reflection
and much greater attenuation of the pulse. The response due to increasing proportions of mineral
was to increase the Ka readings in both cases.
Influence on water content estimation
The relationship between soil dielectric and water content has been demonstrated by a number of
authors (Hoekstra and Delaney, 1975; Topp et al., 1980). The results shown here would
indicate that soil mineralogy may well have a substantial influence on calibrations of dielectric
constant vs. Water content. The presence of 15% goethite is unlikely to alter estimations
of water content achieved through a standard calibration. The presence of 15% hematite may
increase the determined water content from a standard calibration in both dry and wet conditions
by about 6%. The hematite appears to have a proportional increase on the measured dielectric
constant suggesting that in soils of low spatial variability its influence could be calibrated for.
15% magnetite may raise water content estimations by as much as 60% under saturated
conditions. The influence of the magnetite was greatly enhanced under saturation. The effect of
this mineral on the soils electrical and magnetic properties may be of great interest in the
consideration of the use of TDR in the few soils where this mineral may occur.
The iron mineral lepidocrocite (
Increases in dielectric constant due to the presence of titanium minerals may lead to an over
estimation of water content using a standard calibration. 20% rutile will mean that an over
estimation of 20% water content is made in a saturated environment. 10% ilmenite would result
in an over estimation of 30%. The ilmenite can be clearly seen to have a much more significant
influence than the rutile under saturated conditions.
TDR is proving to be a very successful technique for soil moisture estimation. This work has
shown tat the iron minerals magnetite and hematite and the titanium minerals rutile and ilmenite
may influence the measurement of dielectric constant using TDR. This in turn means that water
content is overestimated when using a standard calibration. For TDR to fully realize its potential
further work is required to give understanding into the influence of certain mineral fractions on
the measurement of dielectric constant and the subsequent estimation of water content.
It would appear that the minerals studied do not have a linear increase on the dielectric constant
measured especially in the presence of water. This may make them potentially difficult to
calibrate for and certainly requires further investigation. The points below outline areas of further
interest:
Anon, 1990. Trase System I Manual. Soil Moisture Equip. Corp., P.O. Box 30025, CA 93105,
USA.
Bain, D. C., 1976. A titanium rich soil clay. J. of Soil Sci. 27:68-70.
Dirksen C. & S. Dasberg, 1993. Improved calibration of time domain reflectometry soil water
content measurements. Soil. Sci. Soc. Am. J. 57:660-667.
Hoekstra, P. & A. Delaney, 1975. Dielectric properties of soils at UHF and microwave
frequencies. J. of Geophysical Res. 79:1699-1708.
Jacobsen, O. H. & P. Schjonning, 1993. A laboratory calibration of time domain reflectometry
for soil water measurement including effects of bulk density and texture. Jour. of Hydrol.
151:2-4, 147-158.
Robinson, D. A., J. P. Bell, & C. H. Batchelor, 1994. Influence of iron minerals on the
determination of soil water content using dielectric techniques. J. of Hydrol.
161:169-180.
Roth, C. H., M. A. Malicki, & R. Plagge, 1992. Empirical evaluation of the relationship between
dielectric constant and volumetric water content and the basis for calibrating soil moisture
measurements by TDR. J. of Soil Sci. 43:1-13.
Sherman, G. D., 1952. The TiO2 content of Hawaiian soils and its significance.
Soil Sci. Soc. Am. Proc. 16:15-18.
Soil Survey Staff, 1975. Soil Taxonomy: Agricultural Handbook 436. Washington, D.C.: Soil
Conservation Service.
Topp, G. C., J. L. Davies, & A. P. Annan, 1980. Electromagnetic determination of soil water
content measurements in coaxial transmission lines. Water Resour. Res. 16:574-582.
Last modified: 06-04-98
![]() -FeOOH is unlikely to influence TDR because
it
is similar to goethite in nature. Maghemite, (
-FeOOH is unlikely to influence TDR because
it
is similar to goethite in nature. Maghemite, (![]() -Fe2O3) present in many Australian soils on the other
hand may
possess an above average dielectric constant and behave in a similar way to hematite and
magnetite. In some iron rich soils the TDR will require its own in situ calibration, in some soils
spatial variability of minerals may rule out its use altogether.
-Fe2O3) present in many Australian soils on the other
hand may
possess an above average dielectric constant and behave in a similar way to hematite and
magnetite. In some iron rich soils the TDR will require its own in situ calibration, in some soils
spatial variability of minerals may rule out its use altogether.