
Chapter 3. Installation and Results
3.1 Site Description and Geology
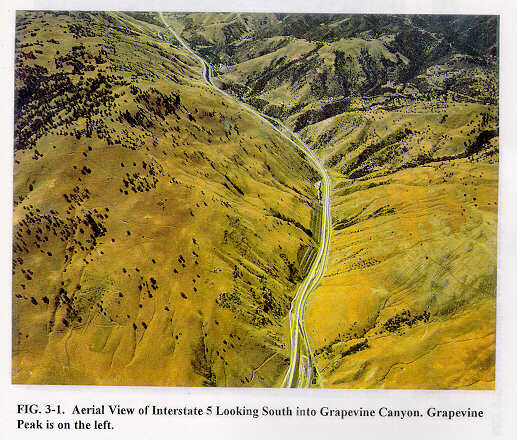
The test site was located between Post Miles 7.4 and 8.1 adjacent to the eastern side of the northbound lanes of U.S. Interstate Highway 5 in Kern County, California. It is in the Tehachapi Mountains of the Sierra Nevada geomorphic province, just south of the Great Valley province, FIGURE 3-1. The site is referred to as the "Grapevine Slide", one of at least five landslides that exist on the west side of Grapevine Peak (Samuel, 1995). Grapevine Peak is approximately 1468 m (4815 ft) high and marks the western extremity of the Tehachapi Mountains, FIGURE 3-1. FIGURES 3-1 and 3-2 show aerial views of the site and FIGURE 3-3 gives the location with respect to Interstate 5.
Samuel (1995) believed that the Grapevine slide is the leading slide of a series of slides on Grapevine Peak dating back at least 10,000 years to either Late Pleistocene or Early Holocene. Only the Grapevine slide appears to have moved in recent time. The toe of the slide has been removed by erosion from Grapevine Creek and excavation for the Interstate 5 right-of-way.
A subsurface investigation consisting of four exploratory boreholes was conducted by the California Department of Transportation (Samuel, 1995). Rocks encountered included highly fractured and jointed diorite, granite gneiss, and granite. Outcrops were foliated and schistose. Rock Quality Designation (RQD) values ranged from 0 to 77%, although values were mostly in the 0 to 10% range. This is indicative of extremely fractured rock, which is very poor for engineering purposes. The material tends to act more as a soil mass and exhibits the characteristics of a circular failure: a noticeable head scarp and distinguishable toe.
The slope is relatively steep, mostly at angles of approximately 2H:1V to 1½H:1V. The active portion of the slide was approximately 100 m (330 ft) high and 105 m (350 ft) long. There was a noticeable head scarp from which water flowed freely during a visit in early February, 1995. The failure plane appeared to daylight in the right shoulder of the northbound lanes. Broken pavement had heaved about 0.15 m to 0.2 m (6 in to 8 in) in places. A low retaining wall was disturbed and leaning out toward the traffic lanes. In February, 1995, the lower portion of the slide had numerous springs which flowed freely. Since that time sub-horizontal drains and a collection system have been installed and water flow has diminished. In August 1995, construction began to install a system of 732 tie-back restraints. Tieback lengths ranged from 46 to 78 m (150 to 255 ft) (Engineering News-Record, 1996)
The TDR installation included a cable tester connected to a coaxial cable. The cable was attached to either an inclinometer or piezometer casing which was grouted into a borehole. The cable tester was connected to a datalogger which records and stores reflections. The datalogger controls the cable tester and supplies power during measurements. It was planned to collect the data by computer automatically from a remote location using a cellular phone. This feature was not operational during the study. The complete installed configuration is shown in FIGURE 3-3.
A total of three RG59/Ucables were installed at the Grapevine site in the locations shown in FIGURE 3-4. TDR 1 was 62.7 m (206 ft) long from the top of the hole. TDR 2 was 78.6 m (258 ft) long, and TDR 3 was 90.2 m (296 ft). long. TDR 1 and TDR 2 cables had a stranded inner conductor, while TDR 3 had a solid wire inner conductor.
Other types of coaxial cables are available. Each type has advantages in terms of ease of installation, weight, and material properties. TABLE 3-1 contains a list of various cables in use in California.
Test holes were made with skid mounted Longyear 34 and 38 drill rigs utilizing 89 mm (3.5 in) o.d. HZ drill stem with either a Christensen HWD3 61 mm (2.4 in) i.d. core barrel or a Mission SD4 114 mm (4.5 in) down-hole hammer. Test holes and cores were logged by a Caltrans engineering geologist at the time they were drilled. Cores obtained were preserved in sample boxes and taken to the Caltrans laboratory.
TDR 1 and TDR 3 were attached to the Caltrans PVC inclinometer casings. TDR 2 was attached to a PVC piezometer. In both cases the holes were grouted by the installer. The TDR cables were installed jointly with other geotechnical instrumentation in the three vertical exploratory boreholes drilled through the slide plane. TDR 1 and TDR 2 were located in the naturally occurring upper bench of the site. TDR 3 was located on the third, or upper, graded bench of the highway cut. For relative locations of test holes see FIGURE 3-4.
The TDR 1 cable was attached to the outside of the inclinometer casing with electrical tape at 3.1 m (10 ft) intervals. This was to keep the cable from spiraling around the casing as it was installed. Inclinometer casing was placed to a depth of approximately 62.7 m (206 ft). To ensure deformation, an attempt was made to keep the TDR cable on the downhill (west) side of the casing as it was placed. The annular space around the inclinometer casing was backfilled with cement grout. The TDR 2 cable was attached to piezometer tubing which was placed to an approximate depth of 78.6 m (258 ft). The hole was backfilled to the 30.5 m (100 ft) depth with pea gravel. A 1.5 m (5 ft) bentonite plug was then placed and the remainder of the hole was backfilled with cement grout.
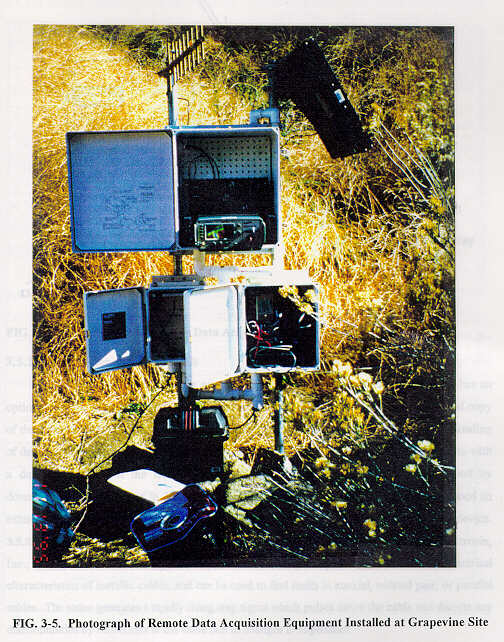
The TDR 3 cable was also attached to the outside of the inclinometer casing with electrical tape at 3.1 m (10 ft) intervals. It was kept on the downhill (western) side of the casing as it was placed to the 90.2 m (296 ft) depth in the borehole. The casing was backfilled with cement grout. Remote data acquisition equipment was installed as shown in FIGURES 3-3 and 3-5.
The system installed at Grapevine used a Tektronix 1502B cable tester and a Campbell Scientific CR10 datalogger with a cellular phone as the primary components. Appendix C Vendors of Equipment for TDR Measurements contains a list of other providers of equipment. A photograph of the equipment is shown in FIGURE 3-5 and components are labeled in FIGURE 3-6. Schematic wiring diagrams are included as Appendix D Wiring Diagrams for Data Acquisition Equipment. The components are described in more detail below, and a list of necessary equipment is given in TABLE 3-2.
A Tektronix 1502B cable tester was used for all data acquisition. Two testers were purchased: one for field installation and the other for laboratory and mobile field data collection.
3.5.2 Cable Tester and Peripherals
TDR data can be acquired in several ways. The Tektronix 1502B cable tester has an options port for several modules. A thermal printer can be plugged in for printing a hard copy of the tester screen, an extended function module can replace the printer for direct downloading of data to a computer, or a synchronous measurement device can be inserted to communicate with a data logger. With the latter two options, data manipulation can be accomplished by downloading digitized files in ASCII format. The laboratory cable tester in this project used an extended function module, while the field installation used the synchronous measurement device.
3.5.2.1 Tektronix 1502B Cable Tester.
The 1502B tester is manufactured by Tektronix (Tektronix, Inc., 1994). As mentioned previously, it uses radar principles to determine the electrical characteristics of metallic cables, and can be used to find faults in coaxial, twisted pair, or parallel cables. The tester generates a rapidly rising step signal which pulses down the cable and detects any discontinuities by reflections in the cable due to changes in impedance.
3.5.2.2 SP232 Extended Serial Function Module.
The SP232 Extended Serial Function Module is a plug-in interface serial for the 1502B cable tester (Tektronix, Inc., 1989). It serves as the data communication device between the cable tester and the computer. It is controlled by the computer and uses the SP software to download cable signatures to the computer. TABLE 3-2 shows the cable pin connections necessary to connect to the serial port of a PC computer.
3.5.3 Datalogger and Multiplexer
The CR10 measurement and control module serves as a datalogger and controller for the remote data acquisition system (Campbell Scientific, 1991). It has 64K bytes of RAM divided into five areas. Two areas are reserved for the system and the input program. The other areas can be allocated as needed and include:
1. Input storage to hold the results of measurements
2. Intermediate storage for intermediate results during calculation processes
3. Final storage for values that will be transferred by cable or telecommunications to a PC, printer, or other final output device
Programming of the CR10 is done with a hand-held keypad, or by computer and downloaded and compiled.
Any cellular phone can be used. A Motorola phone was used in this research. A handset was obtained and was used with the phone. It is not necessary to have a handset, but it is helpful to check for signal quality.
A 12 volt DC power supply is necessary for the 1502B cable tester. For the mobile system, a rechargeable battery is installed in the back of the tester. An electrical cord plugs into a 120V AC outlet to supply power directly, or to recharge the battery.
For remote data acquisition, a continuous supply of power is necessary at the site. A solar collector panel supplying DC power directly to a deep cycle marine battery was used in this study. Results over six months indicate satisfactory performance. However, water during a heavy storm shorted the wires leading from the solar collector to the battery. The wires burned but the system components were undamaged.
Several software programs are used with the datalogger and communications equipment. The list of programs and their functions is given in TABLE 3-4.
SP was developed by Tektronix (Tektronix, 1989) to allow a direct link between the PC and the 1502B cable tester. It is DOS-based, and the screen looks similar to the screen of the 1502B. The user prompts the software to contact the cable tester and the data is downloaded to the PC. The appearance of the PC screen is the same as the tester. The screen may then be saved as an ASCII file for use with other software such as NUTSA or a spreadsheet.
3.6.2 Campbell Scientific Programs
The suite of programs developed by Campbell Scientific (1995) allows the development and implementation of data acquisition and storage from the cable tester and data logger. A brief description of the programs and a reference for each is contained in TABLE 3-4.
To compare signatures over time, a computer program was developed by Northwestern University and a user's manual was written by Huang et al. (1993). The Northwestern University TDR Signature Analysis (NUTSA) program allows the user to view up to three waveforms simultaneously. The program displays up to three waveforms just as they look on the screen of the 1502B cable tester. If desired, two waveforms can be viewed with the third location used to display the difference between the two. FIGURE 3-7 describes one method to edit TDR signatures and import them into a word processor document.
CANMET is currently developing a program similar to NUTSA that will be WindowsTM-based (Hamil, 1995).
The system can uses several methods to acquire data. One is by direct connection of a cable to a laptop computer. This requires a site visit by personnel. The other methods involve the use of a datalogger. The datalogger can be accessed on-site by a hand-held keyboard display (CR10KD). Remote access requires the use of a radio transceiver, cellular phone, or satellite uplink.
3.7.1 Data Acquisition by Cable Tester and Laptop Computer
The easiest and most straightforward way to obtain cable data is by visiting the site with cable tester and laptop computer. The tester must have the SP232 module and the SP program must be loaded on the computer. FIGURE 3-8 contains the procedure for obtaining signatures using the laptop.
3.7.2 Data Acquisition Program
It is necessary to use a data acquisition program to control the datalogger and peripherals. The program turns on the cable tester, collects cable signatures via the multiplexer, and stores them in the datalogger for remote access by cellular phone. The program is listed below in bold print with line-by-line explanations on the right. Refer to the PC208 manual (Campbell Scientific, Inc., 1995) for programming instructions using EDLOG and the datalogger manual (Campbell Scientific, Inc., 1991) for explanation of commands.
The datalogger uses two communication programs to obtain data. GraphTerm emulates a computer terminal and is used to download from the datalogger directly to the PC. Telcom allows the user to call the unit and access data. Instructions for using both programs are given in FIGURES 3-9 and 3-10. Note that various equipment and user preference may dictate changes. Refer to the PC208 instruction manual (Campbell, 1995) for additional information.
3.8 Signature Analysis of Grapevine TDR Cables
TDR signatures were collected from Grapevine cables by means of site visits and laptop computer data acquisition. Data was required at the beginning of the research project since it appeared the slope was moving. Data was collected on April 27, June 16, November 13, 1995 and January 20 and April 6, 1996. Signature resolutions varied from low to high. High resolution signatures have the disadvantage of requiring several tester screens to obtain the full length of a cable.
Early inclinometer readings and cable signatures showed no movement in the slope. Subsequent inclinometer data suggested movement at a depth of about 42.6 m (140 feet) (Beck, 1996). FIGURES 3-11, 3-12, and 3-13 show cable signatures for the three cables. It should be noted that the horizontal resolution on the signatures is low and may not show the small movements that a higher resolution reading might show.
FIGURE 3-11 shows four readings for Cable #1 a fifth reading was not possible since the cable was damaged. The spike at the beginning of the cable is the reflection of the cable connector. The spike at the end of the signature is the end of the cable. Examination of the signatures reveals little change over time.
Cable #2, FIGURE 3-12, also indicates little change with time. There was a long length of cable from the connector to the beginning of the hole for this cable, so the signatures have been edited to show most of the length. Cable #3, FIGURE 3-13, shows no change with time. Again the signatures have been edited and "0" indicates the beginning of the hole (not the beginning of the cable).
The cable signatures do not indicate any significant movement in the slope. Movement would be indicated by a noticeable spike or jump in the cable where it has broken off. This situation may be due to the fact the cables are attached to the outside of the inclinometer casing. It does not mean that the slope is not moving, nor does it mean that the method does not work. To get any shear in the cable the grout surrounding the cable would have to break and shear the cable. It is probable that the casing is deforming and not allowing the cable to shear. Only with significant movement, for example, that experienced at Last Chance Grade (Kane and Beck, 1994), would the cable be damaged.
Beck, T. J. (1996). Personal Communication.
Campbell Scientific, Inc. (1991). "CR10 Measurement and Control Module Operator's Manual." Revised 3/94, Campbell Scientific, Inc., Logan, UT.
Campbell Scientific, Inc. (1995). "PC208 Datalogger Support Software Instruction Manual." Revision: 1/95, Campbell Scientific, Inc., Logan, UT.
Engineering News-Record (1996). 236 (6), 14.
Hamil, G. (1995). "Reflex Software Program Technical Description and User's Guide." Unpublished Report, Canada Centre for Mineral and Energy Technology, 19 p.
Huang, F.-C., O'Connor, K. M., and Yurchak, D. M., and Dowding, C. H. (1993). "NUMOD and NUTSA: Software for Interactive Acquisition and Analysis of Time Domain Reflectometry Measurements.&" Bureau of Mines Information Circular 9346, 42 p.
Kane, W.F. and Beck, T.J. (1994). "Development of a Time Domain Reflectometry System to Monitor Landslide Activity." Proceedings, 45th Highway Geology Symposium, Portland, OR, 163173.
Samuel, C. (1995). "Grapevine Slide." memorandum to Roadway Geotechnical Branch (North), June 15, 1995, File No. 06-KER-7.0/8.0 NB 06-379904, California Department of Transportation, Office of Structural Foundations.
Tektronix, Inc. (1989). SP232 Serial Extended Function Module Operator/Service Manual, Textronix,l Inc., Redmond OR, 103 p.
Tektronix, Inc. (1994). 1502B Metallic Time Domain Reflectometer Operator Manual, 070-6266-01 Textronix, Inc., Redmond OR.
Last modified: 06-18-97
| Table of Contents
| Executive Summary
| Chapter 1. Introduction
| Chapter 2. Laboratory Testing |
| Chapter 3. Installation and Results
| Chapter 4. Discussion
| Appendices
| List of Figures and Tables