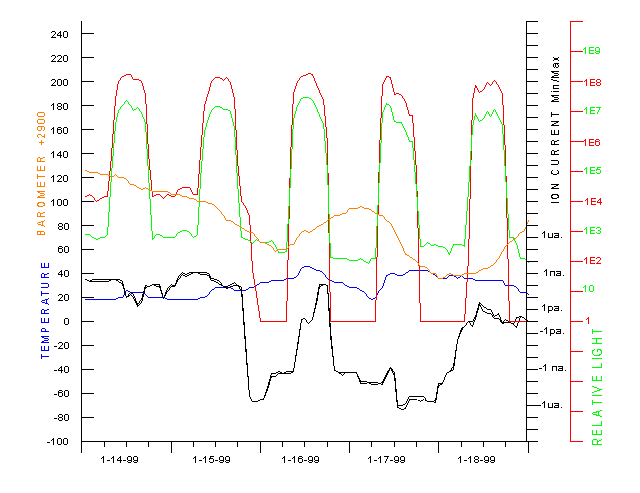

The red and green sky light components (red and green traces) and the ion current (black trace) are plotted on a logarithmic scale. The unusual portion of these plots involve the red sky light component and the ion current. As shown, the red level did not go to a very low level (zero) during the first two nights. At the same time, the ion current was positive which was also unusual. After sunset of the third day, both the red light and ion current rapidly return to a more normal level while the green level remained relatively constant thruout the five days. The red light and ion current for the last three days were representive of normal conditions. Although not shown here, the green and ion current levels were similiar for the prior several days.
These results and another more complex example were unexpected since the light monitoring was installed after reviewing the "haze monitor project" and the ion current monitor was in place as part of the severe weather monitoring project. Reference schematics illustrate the technique for logarithmic measurements.
This is a rather brief description of the observation and I will be happy to go into more detail if desired. Please contact me with comments or questions.