Circuit boards are available for all the following construction, except the Antenna Array Signal Simulator and the Experimenter A/D, from FAR Circuits. See References for details.
1. Test Signal Source This device generates a directional magnetic field that approximates the waveshapes of both intracloud and return strokes. When placed inside the antenna array loops, it will simulate a signal from any selected direction simply by adjusting its orientation. A voltage field signal is also generated for connection in place of the voltage field antenna. It has the same waveshape and timing as the magnetic field signals, and approximates the same source capacitance as that of the voltage field antenna. Strokes of either polarity can be simulated at two different magnitudes.
This source allows testing of the Antenna Array performance when supplemented with an oscilloscope. It is also used in making final adjustments when the rest of the system has been constructed. It is a very useful signal source when real lightning is not available.
2. Antenna Array The Antenna Array is the most involved piece of construction. It is, of course, required to acquire the lightning signals and for most testing of the system as further construction progresses. A good deal of thought should be given to the placement of the Array. On the one hand it should be placed as high as possible and, ideally, have a clear electromagnetic view of all 360 degrees of the horizon. On the other hand, it needs to be easily accessible for testing and trouble shooting purposes with the aid of the Test Signal Source.
With the Antenna Array and an XY oscilloscope, some experience can be gained with direction finding of transient impulse sources. However, without the benefit of the additional circuitry in the system and of the computer display and software, there will be 180-degree direction uncertainty in the results.
3a. Antenna Array Signal Simulator This test source has been replaced by the Lightning Stroke Simulator, below, and is listed for reference purposes only. No circuit board is available from FAR Circuits. This is a second test signal source that can be used at the bench for testing and adjusting the GP-1 system independently of the Antenna Array. It generates signals that simulate those arriving from the Array, and so may be more convenient than using the Test Signal Source and the Array for troubleshooting and most initial adjustments. It generates voltage field (E-field) signals of either polarity and magnetic field (B-field) signals (NS and EW) that simulate the eight major bearings. Both the E-field and B-field signals are generated at two selectable amplitudes.
3b.
Lightning Stroke Simulator (Added Spring, 2001) This is a new test signal source to replace the Antenna Array Signal Simulator above. It can be used at the bench for testing and adjusting the GP-1 system independently of the Antenna Array. It generates signals that simulate those
arriving from the Array, and so may be more convenient than using the Test Signal
Source and the Array for troubleshooting and most initial adjustments. It generates
voltage field (e-field) signals of either polarity and magnetic field (b-field) signals (NS and EW) that simulate any desired bearing. Both the e-field and b-field signals are generated at any selectable amplitude from zero to 5 volts.
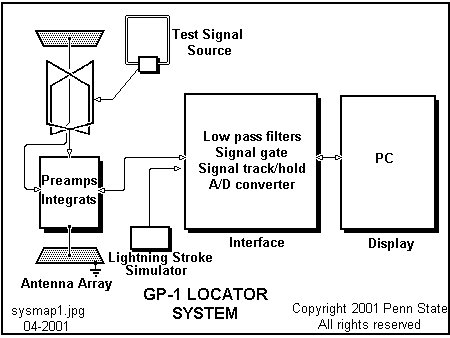
4. Interface
Cabinet The Interface Cabinet houses all
of the remaining circuit boards, power supplies, and connectors.
5. Low
Pass Filters The Low Pass Filters will
reduce AM radio broadcast interference that usually accompanies the three
signals (NS, EW, and e-field) in most communities in North America.
The Filters may not be required if the GP-1 installation is more than 50
miles from an AM broadcast station.
7. Signal
Track/Hold The peak magnitudes of the four signals,
E1, E2, NS, and EW, are converted to 100 millisecond-duration analog pulses
(E1off, E2off, NSoff, and EWoff, where off denotes offset)
of proportional magnitude. These pulses are of sufficient duration
for scanning by the A/D converter, The
Experimenter (see step #8 below), under the command of software
and the valid signal pulse, H. Since the A/D converter
can only handle single polarity or monophasic signals between 0 and 5000 millivolts (mV),
the bipolar or biphasic lightning signals, of up to +/-2500 mV, are offset by about
2500 mV to fall within the allowable A/D input range. Software later
converts them back to their biphasic form.
8. Experimenter
A/D If this item is purchased in kit form,
then it should be assembled and tested in accordance with the manufacturer's
instructions. When the board is functioning properly with analog
test signals, the two connectors, J66 and J69, should be added to the wiring
grid portion of the circuit board. Since some PC serial ports do
not hold DTR high, this is ensured by adding the resistor shown on the
Experimenter A/D circuit.
10. Final Installation
Suggestions Both the Test Sources and real lightning signals
are used for system tuning.
6. Signal
Gate Six gate pulses (H, gop, clin,
opin, clip, and opip; see Signal Gate & Signal
Track/Hold Waveforms Chart)
are derived from the e-field lightning stroke signal. (A seventh pulse,
G, is also generated for use by an optional direction-only display.)
The leading edge of all pulses occurs at the peak of the stroke signal.
These pulses operate analog switches on the Track-Hold board to capture
the peak magnitudes of the initial e-field peak (E1), the first overshoot
(E2) and the b-field peaks (NS and EW) from the pair of loops. A
few adjustable trimming potentiometers, trim pots, on this board
require some adjustment for optimum timing and triggering thresholds.
This board must be functioning properly before attempting tests and operation
of the remainder of the system.
9. Software In this section, download the program SL201.EXE and the associated
ASCII files states.txt, cities.txt, pacities.txt, kscities.txt, param.txt, sitecor.txt,
and example.log. The file SL201.EXE is a stand-alone executable
written in QuickBasic 4.5; the QuickBasic application program is not needed to
run this code. SL201.EXE is best run under DOS but may be run in a DOS window under Windows 3.1, 95 or 98 but not
Windows NT. The file states.txt is a modified version of the state borders file created by NWS Lead Forecaster Mark Mitchell, who has kindly allowed us to use it to improve the map display; this file contains the latitude and longitude coordinates of the US state borders. The file cities.txt is used to specify the
location of the map center as well as the locations of surrounding cities.
The files pacities.txt and kscities.txt are the ones we use
in the Pennsylvania and Kansas installations and serve as samples of the
file cities.txt. The file param.txt sets the values
of the user-specified parameters needed by the program to identify and
locate the lightning activity. The file sitecor.txt contains
the bearing-dependent factors used to adjust the approximate locations
of the activity. The file example.log is a sample of
archived data that can be run as a fast-time loop. A Visual Basic version of
the code that will include improved map generation and other plotting options
is under development.