
TSCM 101 - Detection, Isolation,
and Evaluation of Spread Spectrum Signals Contrary to popular belief Spread Spectrum eavesdropping
devices are very easy to detect, but tricky to demodulate.
Spread Spectrum modulation methods only protect against CASUAL
detection, and allow "Multiple Usage Access" to the frequency
being used. In all reality it doesn't provide even minimal
protection against detection or interception (just the illusion
of privacy or security) While it's helpful to demodulate the signal as an aid to in
the identification of unknown signals it's a serious liability
to rely too heavily on demodulation analysis. Of course, it's
typically not a TSCM'ers job to demodulate the signal, but to
isolate and locate what is generating the suspect signal. What follows are several issues and methods involved in
identifying the threat associated with spread spectrum
eavesdropping signals.
First, we must use a high gain professional grade antenna,
preamplifier, and low loss cables to collect and concentrate as
much of the signal as possible. This is important as SS
eavesdropping devices commonly place the signal "on top of or
inside" an already occupied band or signal (such as the FM
band). Second, we must apply very wide bandwidths (typically over 1
MHz), and sweep the frequency range being monitored as quickly
as possible (at least 100 times per second). The bandwidth being
used in the instrument must be equal to or greater than that of
the primary lobe. Third, The noise floor and distortion must be isolated and
characterized. This is done by allowing the equipment to warm up
and performing self-alignment routines to stabilize the
instruments. Next disconnect the antenna and terminate the cable
with a lab grade terminator (is possible terminate after the
balun). Generate a noise floor correction table, but ensure that
each table covers no more then 200-250 MHz of spectrum
(typically 4096 correction points per 250 MHz of Span). Fourth, reattach the antenna (or other transducer) and pan in
the space domain relative to the antenna sensitivity or field
patterns. Fifth, Change polarization and repeat until each axis
(including polarization) of the antenna has been utilized. The end result of these five steps will be an amplitude
corrected series of traces (one for each antenna position). The
traces, which may show a noticeable increase in the noise floor,
will require further investigation. Remember that we are looking
for "virtually invisible" signals, so analysis at the noise
floor level is most critical. Sixth, orient the antennas along each axis so as to optimize
signal amplitude.
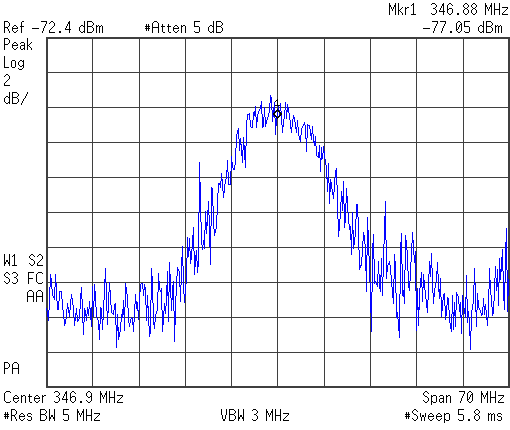
Seventh, Adjust the span of the spectrum analyzer so that the main lobe of the signal (or noise floor hump) is centered on the display, with the center of the first side lobes placed on the far edges of the frequency domain display. See the above image to see what this should look like.
Eight, Place the analyzer in Zero Span, or utilize an external oscilloscope or digitizer. Apply a bandwidth filter that is roughly the width of the primary lobe, and optimize the amplitude and X-axis to stabilize the display (using a threshold trigger will be helpful).
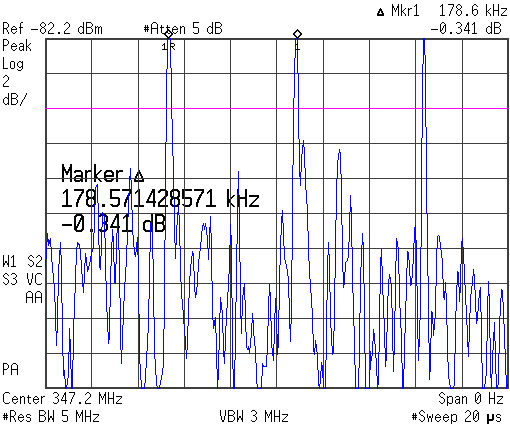
Ninth, Measure the pulse repetition frequency (in the time domain), and pulse width or duration. Also, record the width of the main lobe. In above image the pulse rate is indicated by the primary markers.
Tenth, Crisscross the primary lobe width, and pulse repetition frequency to a list of known spread spectrum signals to determine what is creating the signal (in the attached example a Spread Spectrum telephone chip was used).
The trick is to first isolate in the amplitude domain, then frequency domain, and then the time domain. Next obtain a signature of the signals by bandwidth (of the main lobe) and pulse repetition frequency. Then simply look up the signature to determine components (or product) being used, and if desired set up to demodulate.
The lookup table really doesn't need to be any more then a few pages long, and high threat entries should be marked in bold.
By using this method you will be amazed at how easy it is to detect, isolate, and locate virtually any spread spectrum device on earth. Direct Spread Spectrum, Frequency Hoping, Chirp, and so on may all be detected and located in the same way.
Demodulation of Spread Spectrum signals is actually quite simple when you realize that only a small number of PN (pseudo-noise) generating algorithms are in common use (such as the 11-bit Barker and related code or cipher sequences).
The entire search sequence is easily computerized to facilitate automated searching for a variety of signals.
Spread Spectrum Eavesdropping Device Analysis
Product consisted of a small aluminum case, semi-rigid antenna, with just enough space for a 9-volt battery, electret microphone, and small circuit board.
Potting compound suspected to be "Bondo" or a similar cheap fiber glass based filler compound.
Device generates a DSSS audio signal around 350 MHz (Crystal controlled), and a 70 MHz maximum signal spread on the main lobe.
The pulse rate measured as 178.57 kHz, which cross references to a DSSS chip set for cordless consumer telephones.
The -72.4 dBm signal reading was taken at a distance of under 3 feet using a tuned antenna. Once a 25 dBm preamplifier was used and the antenna polarization matched to the device a detection range of several hundred feet was obtained.
Total power output is well below 50 mW, and was measured via a direct copper-to-copper connection (at the antenna) to be just under 3.5 mW.
Internal components traced to a component distributor in India, PCB is very poor quality and almost looked "homebrew".
Batch code on SS chip traces to a batch made to be shipped into India. Component date codes reflect date of late last year.
Markings on PCB and other components also trace back to India.
Fairly primitive, but very effective.
The bill-of-materials would cost no more than $35, but the products are being openly sold (in Spy Shops) for over 50 times that amount.
Detectable by a simple RF scan using an RBW of 10 or 5 MHz and using a highly directional antenna such as a log periodic with a preamplifier.
Click HERE to obtain more TSCM Tutorials
![]()
Any comments or questions regarding this specific page?
Please feel free to sign our Guest Book
![]()
|
To be contacted for a confidential consultation please E-mail: jmatk@tscm.com
or send a letter via US Mail to:
or call:
URL: http://www.tscm.com/ |