![]()
MedFER beacons broadcast with 100 mw power in the 1600 to 1700 kHz band. DXing these very weak signals is a fascinating way to test receivers, antennas and especially filters, both IF and audio. Filters help greatly because random noise is reduced by 10*LOG(bw2/bw1) in dB, where bw is the filter bandwidth in Hz. For example, in going from a 3000 Hz filter to a 1000 Hz filter, random noise is reduced 4.8 dB, while a CW signal should remain the same amplitude for an ideal filter. Noise in this band is not the pure white variety, however, and has a strong spike component due to thunderstorm static, electrical line noise and atmospheric noise. This demands that filters not add excessive additional length to the noise spikes, while still doing a good job of filtering the signal frequency.
While DXing MMedFERS during this year's winter season I became interested in filter performance. Having accumulated several receivers, I like to test them against each other during actual on the air listening sessions. The most important piece of test equipment for this is a simple switch that both changes the input (antenna) and output (audio) at the same time. This allows me to compare many (up to four) receivers on the same signal under the same conditions of noise, fading and QRM without loss of time changing connections.
One of the receivers tested is the Watkins-Johnson HF-1000. I'm sure most of you are familiar with the specs for this receiver: 58 digital filters with "brick wall" shape factors near one that, as everyone knows, are supposed to be optimum for reception. During listening, therefore, I was surprised to hear some of my older, not as well known, receivers perform noticeably better than the HF-1000 on weak beacons. This is especially true in conditions of high QRN. I was able to hear and copy CW IDs with these old surplus receivers that were lost in what appeared to be noise from the narrow, sharp digital filters. In fact, using the narrowest filter (56 Hz) on the HF-1000 actually sounded worse than a wider filter (1000 Hz). This article will examine the reasons for this discrepancy.
Those of you who are acquainted with receiver specs know about filters. The important parameters that describe filters are: bandwidth, shape factor, bandpass ripple, phase, insertion loss and ultimate rejection. The two that are most important for what I'll be discussing in the following are bandwidth and shape factor. These are both described in the frequency domain. The bandwidth is given in Hz, and shape factor is the ratio of the bandwidth at 60 dB attenuation to the bandwidth at 6 dB attenuation. For CW reception, the best bandwidths are in the range of 100 to 500 Hz, and optimum shape factors are always assumed to be as small as possible. For example in the recent book Shortwave Receivers Past and Present (1) on page 19 you will find the following quotation: "The closer this number is to the ideal "1", the steeper are the filter's "skirts" and the better the filter is at simultaneously passing the desired signal and rejecting others.". This is obviously true for rejecting other CW signals, but may not be the best filter for rejecting random noise or even the sidebands of adjacent AM signals (2). If fact, rejection of noise is best considered from the viewpoint of the time domain rather than the frequency domain.
Anyone who has studied physics and taken some courses in quantum mechanics should be familiar with uncertainty relations. The uncertainty principle says that for measurements in one domain, there is a complementary domain. For example, for momentum, the complementary domain is position in space. For energy, the complementary domain is time. For each domain and its complementary domain, there exists an uncertainty relation of the form:
![]()
This is the uncertainty relation for energy and time. It says that the product of the uncertainty in energy and the uncertainty in time is equal to or greater than a constant. In data processing, there is a similar relation between frequency and time. That uncertainty relation is:
![]()
The two domains in this relation are frequency and time. This relation means that the more we try to pin down things in one domain (the frequency domain), the more they spread out in the other domain (the time domain). For a "brick wall" digital filter, the time response, called the impulse response will be spread out much more than the impulse response of a filter with a larger shape factor (usually considered being a poorer quality filter).
To measure the impulse response of a receiver, we need to input an impulse (spike) into the antenna, then record the output at the audio connector. There are some problems with doing this. First of all, to get a spike of enough amplitude to give decent size audio responses, there is a danger that the front end of the receiver will be overloaded. I got around this problem by inputting a few cycles of an HF frequency to which the receiver could be tuned. Inputting the signal from a crystal controlled signal generator controlled by a noise gate circuit allowed just a short piece of the desired frequency to be seen by the receiver. The noise gate is controlled by a function generator with triangle wave output and DC bias. The level of DC bias controls how long the noise gate remains open, and therefore the length of signal input. At the audio output of the receiver I used a Radio Shack Probescope to digitize enough of the audio to capture several impulse responses. I wrote a program to use the Probescope files to make traces for further analysis and display. The following shows a schematic of the equipment used:
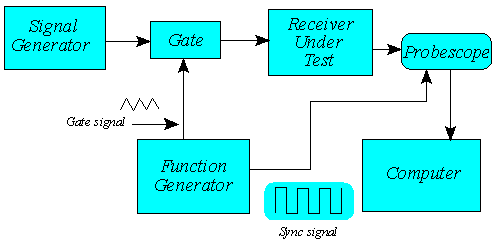
Impulse Response of the Watkins-Johnson HF-1000 Receiver
The following plot shows the measured impulse response of the HF-1000 100 Hz filter:
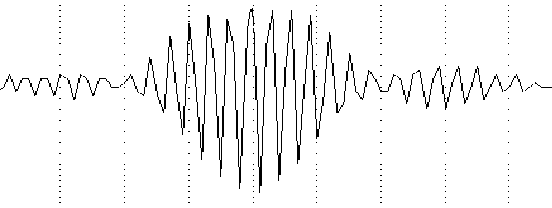
The vertical timing marks are at five msec intervals. The plot shows a 600 Hz sinusoid (the BFO frequency) modulated with an envelope with a sin(x)/x (sync) function. The sync function is the Fourier transform of a boxcar in frequency space, which is the HF-1000 digital 100 Hz filter. This curve can also be obtained by Fourier transforming the measured filter's amplitude spectrum:
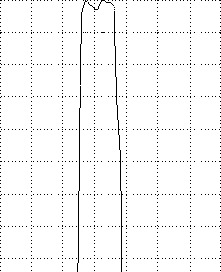
On this spectrum plot, the vertical dashed lines are at 100 Hz intervals, and the horizontal dashed lines are at 10 dB intervals. The filter is centered at 500 Hz, and is 100 Hz wide.
Now, I will go through identical steps for one of the receivers that comes out on top for medFER DXing. This receiver was made for the Navy in the late 1960's by Sylvania Electronic Systems. It is all solid state with plug-in circuit board cards. Frequency readout is from a nixie display driven by an internal counter. The local oscillator is analog, but can be locked at 100 Hz points, if desired. The front end is very quiet with a noise factor of 7 dB. There are five 455 kHz crystal filters, but the only one I'll be discussing is a 100 Hz filter. When I want to pull out a weak signal in noise, this is the filter of choice.
Here is the impulse response for the R1414 100 Hz filter:
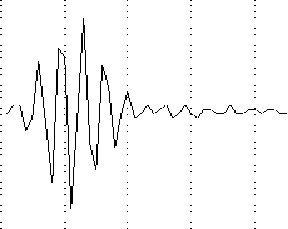
The timing lines on this plot are once again at five msec intervals. Notice how much shorter this impulse response is than that from the HF-1000 receiver. Also, there are no sidelobes from a sync function, due to this filter's sloping amplitude spectrum:
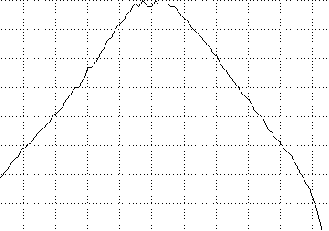
On this plot, horizontal lines are dB scale at 10 dB intervals, vertical lines are 100 Hz intervals and the filter is centered at 500 Hz. The bandwidth is actually about 200 Hz at -6 dB and the shape factor is close to five. The bandwidth printed on the side of the filter itself is 100 Hz, but this measurement must have been made at -3 dB.
Previous to this investigation I had assumed, like most of you, that a bandwidth and shape factor were all important parameters for choosing filters. This is only true when the interference that is to be eliminated is of the coherent CW type. When interference is random noise or sideband splatter then it pays to look at the filter response in the time domain. After filtering, each noise spike has the shape of the impulse response, and the length and sidelobes of the response are critical in being able to hear a weak signal in filtered noise. I believe these account for the R1414 receiver sounding so much quieter than the HF-1000 in the presence of noise.
It remains to try to determine the optimum combination of shape factor and impulse response to give the best reception. Soon I hope to have a test setup to simulate weak CW signals in noise. In future articles I'll be looking at several other receivers as well as add on audio filters. I expect to find similar conclusions about brick wall DSP audio filters.
1. Shortwave Receivers Past & Present is available from Universal Radio, Inc., 6830 Americana Pkwy., Reynoldsburg, Ohio
2. See the review of the HF-1000 in 1995 WRTH, especially page 594.
(This document is protected under U.S. and international copyright laws. Obtain the author's permission before distributing in any form.)
Return to LF Receiving Library.