Understanding Mixers

As a rule-of-thumb, the intercept point is approximately 10 to 15 dB higher than the 1 dB compression point; at low frequencies about 15 dB, and at higher frequencies about 10 dB. See Fig. 7.
how to measure mixer performance
A manufacturer with integrity does not play the "numbers game" when preparing specification data on his product line. Mini-Circuits' policy for product measurement and specification is straightforward - present the honest facts so the design engineer can evaluate product data for his circuit and system requirements and arrive at a proper design decision.
A 50-ohm broadband system is used for all factory measurements. It offers the customer a convenient and consistent means to obtain correlation with data prepared by Mini-Circuits.
conversion loss measurements
For conversion loss measurements, Fig. 8a, fixed attenuator pads are connected to all three ports so the mixer sees 50 ohms at the frequency of interest and all harmonics. An RF input level of -11 dBm is deliberately selected. Here's why, assuming a typical 6 dB conversion loss, the IF output would be -17 dBm. Mini Circuit's mixers provide LO-IF isolation typically in the order of 50 to 60 dB. Normally, the LO input is +7 dBm and thus with 50 dB isolation, the LO leakage level of -43 dBm would be much lower than IF output. Therefore the RF input level is high
Figure 7

The 1 dB compression point is an indication of a dbm's dynamic range and maximum power capabilities.
enough to operate the mixer in its linear range and not low enough to allow LO leakage to destroy the integrity of the measurement.
For the IF power level measurement, a filter is included before the broadband RF voltmeter, to reject all responses other than the desired IF. When a crystal filter is used, LO leakage would have no effect on the conversion loss measurement since it would not reach the RF voltmeter.
two general techniques for measuring isolation
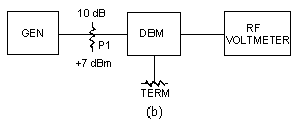
There are two general techniques for measuring isolation, both requiring 50 ohm terminations at the unused ports. When measuring LO-RF isolation, see Fig. 8(b), a pad is placed between the generator and DBM to ensure a 50-ohm-impedance. Also, a 50-ohm termination is connected to the IF port and the power at the RF port is measured to obtain the isolation performance.
When measuring isolation from RF-IF or RF-LO, the power applied at the RF port is set at a high level to make sure the diodes have sufficient drive power. This RF power level will be higher than encountered in actual DBM usage. However, the measurement results can be considered quite accurate.
The RF voltmeter technique actually produces isolation specs that are conservative since many applications normally involve narrowband circuits and filters that would eliminate harmonics. By assuming everything measured on the RF voltmeter is due to the fundamental and that harmonics are not present, mixers supplied by Mini-Circuits perform better than expected from the data sheet specs.
Replacing the RF voltmeter by a spectrum analyzer enables the following improvement in measurement integrity. First, the power at the fundamental frequency of measurement can be observed. Now, for broadband applications, the effects of harmonics can be judged. For narrow-band applications, only the fundamental need be considered. By using the spectrum analyzer technique, the design engineer can avoid over specifying his DBM isolation requirement with subsequent cost savings.
Here's another important advantage of the spectrum analyzer technique. When RF-IF or RF-LO measurements are made, the RF and LO levels can now be set at the normal operating level under which the DBM will be used.
VSWR measurements
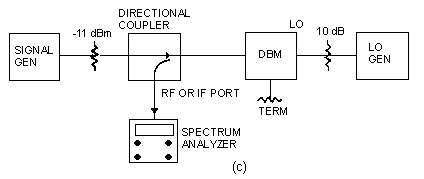
VSWR measurements are made under the same dynamic conditions that the mixer would encounter in practice, see Fig. 8(c). First, let's consider VSWR measurement at the RF port. An LO signal is applied to its port and the unused IF port is terminated in 50 ohms. The RF generator supplies an input level corresponding to linear mixer operation. With the double- balanced mixer disconnected from the directional coupler, a reference level is obtained (all the RF power is reflected back). The amount of reflected signal depends on the directional coupler used; a 20 dB coupler would establish a reference level 20 dB below the RF input. Next, the mixer is connected to the output of the directional coupler. The spectrum analyzer acts as a narrow-band filter and allows observation at the RF input frequency. The RF power reflected back from the mixer is displayed and can be measured by the calibrated scale on the spectrum analyzer.
The VSWR at the IF port is measured in a similar fashion. In this case, the RF port is terminated in 50 ohms.
Broadband mixers, it should be noted, exhibit a different VSWR characteristic at different frequencies. Factors causing this include circuit resonances and changes in diode impedances as the LO power level changes. Also of importance is the fact that the input impedances of the various ports are load dependent, even though they are isolated from each other. At high frequencies, this effect is more noticeable since isolation tends to drop as frequency increases.
| Figure 8 | |
 |
 |
 |
 |
two-tone, third-order intermodulation distortion
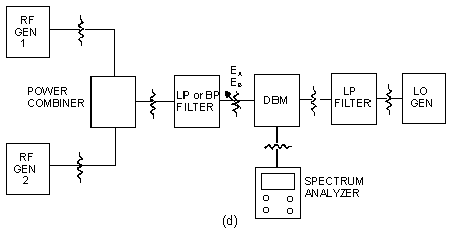
Two-tone, third-order intermodulation distortion takes place when two incoming signals arrive at the mixer RF port and interact. The signals resulting from the interaction may be objectionable within the IF response.
Last Updated: 12/22/1999