Buy and download my eBook: The
PID Control Algorithm:
How It Works and How To Tune It. 58pp
MS Word 97 or .pdf file
only $9.50.
Get more details, buy, and download
| ControlSim The PID controller and process simulator based on MS Excel spread sheets. $45.00 | Click here to get more details, buy, and download |
Buy and download my eBook: The
PID Control Algorithm: |
Get more details, buy, and download |
Chapter 6
Loop Tuning
Tuning Criteria
or
"How do we know when its tuned"
Elementary methods
1 The plant didn’t blow up.
2 The process measurements stay close enough to the setpoint.
3 They say it’s OK and you can go home now.
Informal methods
1 Optimum decay ratio (1/4 wave decay).
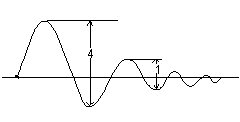
2 Minimum overshoot.

3 Maximum disturbance rejection.
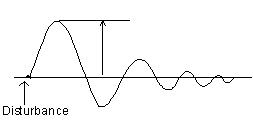
The choice of methods depends upon the loop’s place in the process and its relationship with other loops.
Mathematical criteria
Mathematical methods—minimization of index

IAE - Integral of absolute value of error
ISE - Integral of error squared
ITAE - Integral of time times absolute value of error
ITSE - Integral of time times error squared:
• These mathematical methods are used primarily for academic purposes, together with process simulations, in the study of control algorithms.
On-line trial tuning
or
The "by-guess-and-by-golly" method
1. Enter an initial set of tuning constants from experience. A conservative setting would be a gain of 1 or less and a reset of less than 0.1.
2. Put loop in automatic with process "lined out".
3. Make step changes (about 5%) in setpoint.
4. Compare response with diagrams and adjust.
Ziegler Nichols tuning method: open loop reaction rate
Also known as the "reaction curve" method
The process must be "lined out"—not changing.
With the controller in manual, the output is changed by a small amount.
The process is monitored.
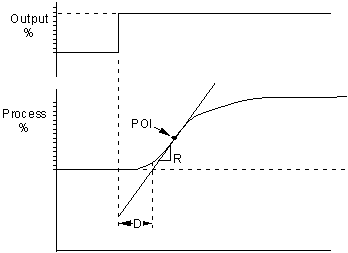
The following measurements are made from the reaction curve:
X % Change of output
R %/min. Rate of change at the point of inflection (POI)
D min. Time until the intercept of tangent line and original process value
The gain, reset, and Derivative are calculated using:
Gain |
Reset |
Derivative |
|
P |
X/DR |
— |
— |
PI |
0.9X/DR |
0.3/D | — |
PID |
1.2X/DR |
0.5/D | 0.5D |
Ziegler Nichols tuning method: open loop point of inflection
Another means of determining parameters based on the ZN open loop.
After "bumping" the output, watch for the point of inflection and note:
T
P
% Process value change at POIR %/min Rate of change at POI (Same as above method)
X % Change in output. (Same as above method)
D is calculated using the equation:
D=T
i - P/RD & X are then used in the equations on the previous page.
Ziegler Nichols tuning method: open loop process gain
Mathematically derived from the reaction rate method.
Used only on processes that will stabilize after output step change.
The process must be "lined out"—not changing.
With the controller in manual, the output is changed by a small amount.
The process is monitored.
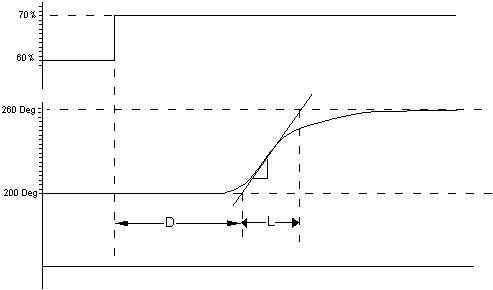
Gp is the process gain - the change in measured value (%) divided by the change in output (%)
The gain, reset, and Derivative are calculated using:
Gain |
Reset |
Derivative |
|
P |
L/GpD |
— |
— |
PI |
0.9 L/GpD |
0.3/D | — |
PID |
1.2 L/GpD |
0.5/D | 0.5D |
Ziegler Nichols tuning method: closed loop
Steps
Place controller into automatic with low gain, no reset or derivative.
Gradually increase gain, making small changes in the setpoint, until oscillations start.
Adjust gain to make the oscillations continue with a constant amplitude.
Note the gain (Ultimate Gain, Gu,) and Period (Ultimate Period, Pu.)
The Ultimate Gain, Gu, is the gain at which the oscillations continue with a constant amplitude.
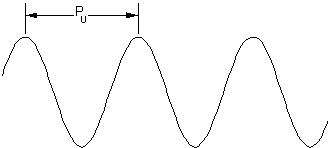
The gain, reset, and Derivative are calculated using:
| Gain | Reset | Derivative | |
| P | 0.5 GU | — | — |
| PI | 0.45 GU | 1.2/Pu | — |
| PID | 0.6 GU | 2/Pu | Pu/8 |
Controllability of processes
The "controllability" of a process is depends upon the gain which can be used.
The higher the gain:
• the greater rejection of disturbance and
• the greater the response to setpoint changes.
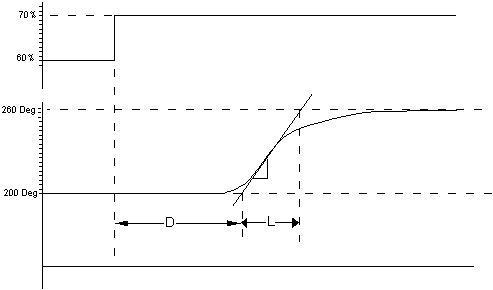
The predominate lag L is based on the largest lag in the system.
The subordinate lag D is based on the deadtime and all other lags.
The maximum gain which can be used depends upon the ratio .
From this we can draw two conclusions:
• Decreasing the dead time increases the maximum gain and the controllability.
• Increasing the ratio of the longest to the second longest lag also increases the controllability.
Flow loops
Flow loops are too fast to use the standard methods of analysis and tuning.
Analog vs. Digital control:
With an analog controller, the flow loop has a predominate lag (L) of a few seconds and no subordinate lag.
With a digital controller, the scan rate of the controller can be considered dead time.
Although this dead time is small, it is large enough when compared to L to force a low gain.
Typical digital flow loop tuning: Gain= 0.5 to 0.7
Reset=15 to 20 repeats/min..
no derivative.
| Buy and download my 21 page e-book on the PID algorithm. MS Word 97 format only $5.00 |
 |
| Buy and download my 25 page e-book on the PID Tuning. MS Word 97 format only $6.00 |
 |