| This version reflects the comments of the core participants as reviewed and incorporated in accordance with CORD's FIPSE-supported Curriculum Morphing Project. | ||||||||||||||||||||||||||||||||||||||||||||||||||||||||||||||||||||||||||||||||||||||||||||||||||
MODULE 4 Changes in red were made as a group by Pete Latham –course director, Yoriko Morita, Nick Massa andTung Jeong. (1)Photodetectors detect and measure the output of a laser or other typical source. They are important in almost all laser and electro-optic systems. The photodetector receives the incident light and converts it into a response that can be measured. This response or output is usually electrical in nature. It gives a measure of the intensity or irradiance of the incident light. A photodector converts light energy into electrical energy, which is the reverse energy conversion to a laser.>A photodetector converts light energy into electrical energy, which is the reverse energy conversion to a laser.</font></p> <p>A photodetector is a device that can provide an electrical response that is a useful measure of incident electromagnetic radiation. An example of a visible radiation detector is one that produces a current as a result of visible radiant energy (light) striking its surface.</p> <p>The optical source under observation may produce a transient optical signal—a short duration, nonrecurrent event or a repetitive phenomenon. One of the main considerations in building a system to record the signal from such a source is the choice of a proper detector to meet certain requirements. In choosing an optical detector, you must consider many factors that may influence the measurement. Manufacturers of photodetectors have in general followed international standards of measurement in describing these characteristics. Some of the more important characteristics will be defined and described in this module.</p> <p>This module will acquaint you with some key photodetector characteristics. These are pertinent to optimizing the selection of components in the design of a system of light detection. You’ll also study methods employed for the measurement of photodetector characteristics.</p> <p>You should have completed one course each in algebra, trigonometry, and calculators. You should have completed the following modules of this series: 5-1, "Light Sources and Their Characteristics"; 5-2, "Radiometry and Photometry"; Module 3-13, "Measurement of Laser Outputs"; and 1-2, "Elements and Operation of an Optical Power Meter."<font SIZE=" 2"> 
When you complete this module, you should be able to: 1. Define the following terms:
2. Describe the experimental setup for measuring NEP. 3. Explain the relationship between D* and NEP for a photodetector. 4. Calculate the value of D* for a detector, given information on the detector NEP and area. 5. Determine the value of the responsivity for a specified detector at a specified wavelength, given information on the detector characteristics. Determine the value of the output from the detector, given information on the input. 6. Calculate the signal-to-noise ratio for a detector, given information on the noise sources, detector characteristics and input signal. 7. Calculate the response time (rise time) of a photodetector, given the rise time of the display device and the measured rise time. 8. Measure the responsivity (R) of a silicon photodiode detector at five different visible wavelengths. 9. Measure the linearity of a photodiode detector over at least five decades. Determine the point at which saturation occurs. 10. Measure the dark current noise for a photodetector. Determine values for both the noise equivalent power and D*. 
(2)Photodetectors are used along with lasers in most practical applications of laser technology. Knowledge of photodetectors and their use is extremely important for the laser technician. (3)For example, photodetectors are used to measure and control the laser power output for metalworking applications. They are needed to measure the position and motion of interference fringes in distance-measurement applications. They are employed as receivers in optical communications. For almost all laser applications they are used to ensure reproducible operating conditions. (4)A photodetector produces an electrical response (current or voltage). It thus provides a useful measure of incident electromagnetic radiation. Photodetectors can be used simply to detect the presence of electromagnetic radiation. Or, they can be used to give a quantitative measure of the radiation (for example, the power level). (5)There are many different types of photodetectors. These include vacuum-tube devices, semiconductor photodiodes, semiconductor photoconductive devices, thermocouples, and so on. The choice of a particular detector depends on the requirements of a specific application. These include the wavelength of the light, the sensitivity needed, the speed of response required, and so forth. Wavelength is especially significant because many photodetectors respond only in certain parts of the spectrum. A detailed description of the various types of photodetectors and the choice of a detector for a particular application will be deferred until the next module. In this present module, we’ll emphasize performance characteristics that are commonly used to describe the operation of photodetectors. You’ll need this information to be able to choose detectors that have the right characteristics for specific applications.
Performance Characteristics (6)A number of important characteristics are commonly used to describe photodetector performance. These performance characteristics indicate how a detector responds to an input of light energy. They can be used to select an appropriate detector for a particular application. Manufacturers of commercial detectors will provide information about the values of the performance characteristics on their own detectors. (7)In general, you want the following properties in a detector: 1. A large response at the wavelength to be detected. 2. A small value for the additional noise introduced by the detector. 3. Sufficient speed of response to follow variations in the optical signal being detected. (8)Several conventional quantities are often used to describe these characteristics. They’re commonly used by scientists and engineers working with photodetectors. These quantities include:
(9)To understand the descriptions of detector performance and to be able to pick a detector for a specific application, you should understand these detector characteristics.
Responsivity (10)Responsivity gives a measure of the detector’s sensitivity to radiant energy. It’s specified as the ratio of the detector output to the light input. For a detector that generates a current output, the responsivity is the ratio of the root mean square (rms) signal current (measured in amperes) produced by the detector to the incident radiant power (measured in watts) at the entrance to the detector. If the signal output is represented as a voltage, it’s the ratio of rms signal voltage per watt of incident radiation. Equations 1 and 2 show these relationships . Thus, the responsivity is essentially a measure of the effectiveness of the detector for converting electromagnetic radiation to electrical current or voltage. Responsivity will vary with changes in wavelength, bias voltage, and temperature. Responsivity changes with wavelength since the reflection and absorption characteristics of the detector’s sensitive material change with wavelength. Temperature changes affect both the optical constants of the detector material and its collection efficiency. For detectors that generate an electrical current:
or
For detectors that are generators of voltage
or R = V/Ee • A
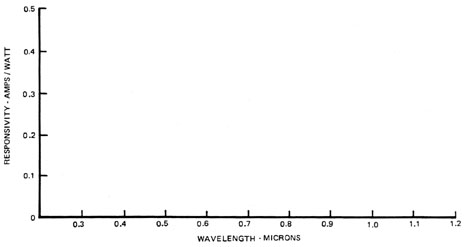
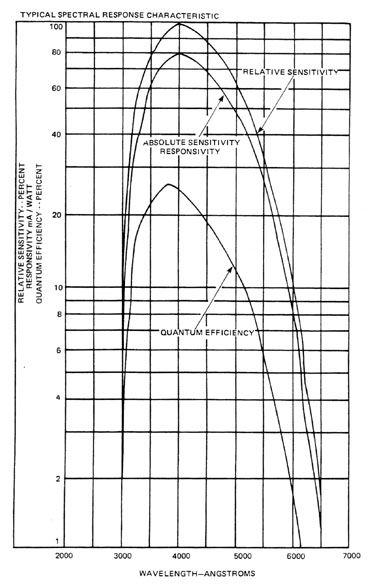
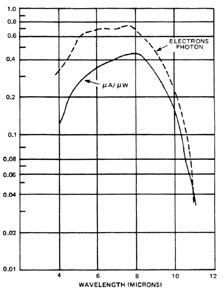
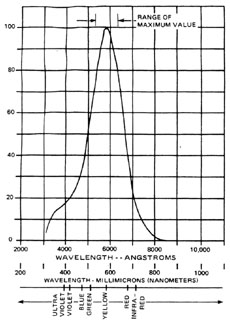
Spectral Response (11)If we plot the absolute responsivity as a function of wavelength, we have what is called a spectral response curve. This curve is commonly shown as a relative response curve in which the peak of the response curve (highest responsivity) is set equal to 100%. All other points are relative to the peak. A common practice is to make an absolute calibration only at the peak of the response curve. Thus, to determine the absolute responsivity at some other wavelength, we find the percent relative response at this wavelength. Then we multiply it by the absolute value of amps/watt at the peak of the curve. Figures 1 through 3 show the spectral response curves of some typical detectors. Note that the characteristics of some detectors may be given in photometric terms like lumens rather than in the more acceptable radiometric terms such as watts. This may create some confusion.
Fig. 1
Fig. 2
Fig. 3
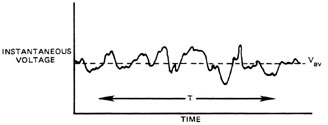
Noise Equivalent Power (12)The responsivity defined above gives a measure of how much output you can expect from a given detector for a specified input. For many laser applications, the signal is much larger than any noise source that may be present. The responsivity alone is adequate to characterize detector performance. But in many other situations you must detect a small signal in the presence of noise. For example, in optical fiber telecommunications, you must detect a laser signal after it has traveled many kilometers through the fiber. The available signal may not be much larger than the noise sources. You must distinguish the signal from the random fluctuations that make up the noise. In this case, other detector parameters become more important than the responsivity. (13)One such parameter is the noise equivalent power (often denoted NEP). The NEP is the radiant power that produces a signal voltage equal to the noise voltage from the detector. (14)Before we describe the NEP in detail, let’s discuss noise sources in photodetectors. Noise is a rather profound subject. In this module we can do little more than present the fundamental ideas and apply them to photodetectors. Noise can be any undesired signal. It can be divided into two broad categories: externally induced noise, and internally generated noise. External noise, as the name implies, includes those disturbances that appear in the system as a result of an action outside the system. Two examples of external noise are hum picked up from 60-hertz power lines and static caused by electrical storms. Internal noise, on the other hand, includes all noise that’s generated within the system itself. We now know that every resistor produces a discernible noise voltage and every electronic device (such as vacuum tubes and semiconductor elements) has internal sources of noise. You can think of internal noise as an ever-present limit to the smallest signal that the system can handle. The NEP is related to the internal sources of noise generated within the photodetector. (15)The first thing to note about noise is that it can’t be described the same way as the usual electrical voltages or currents. It’s common to think of a current or voltage in terms of its behavior with time. For example, we think of a sine wave as periodically varying with time, a direct current as being constant with time, and so on. Now, let’s look at the noise output of any electrical circuit as a function of time. We’ll find that the result is completely erratic. That is, we can’t predict what the amplitude of the output will be at any specific time. Also, there’ll be no indication of regularity in frequency in the waveform. When completely unpredictable conditions such as this exist, the situation is described as random. (16)A record of the output from a random noise generator might look like that shown in Figure 4. Figure 4 is a graph of the instantaneous voltage as a function of time. Because of the random nature of the noise, the voltage fluctuates about an average value Vav. How can you describe these fluctuations? A simple average is meaningless, since the average of the variations is zero. Rather, it’s convenient to use the average of the squares of the deviations about Vav. The average is taken over a time interval T that’s much longer than the period of the fluctuations. Equation 3 shows this mathematically.
Fig. 4
(18)You probably wouldn’t calculate the noise voltage directly from this equation unless you went through a laborious process. The important thing, though, is how this voltage is properly measured. What about measuring the noise voltage? What kind of meter do you use? A true-rms meter is the best type for making noise measurements. It takes sophisticated circuitry to square the point-by-point voltage along one cycle of the waveform and then extract the square root of the average value of the squared quantity. Meters of this type include the so-called electrodynamometer. This class of meter was, at one time, the only one that would give an accurate reading of the rms values of a nonsinusoidal waveform such as that generated by random noise. (19)This is, however, no longer true. Many relatively inexpensive digital voltmeters and digital multimeters are now available with a true-rms option. Recent advances in microchip technology have made this possible. You must, however, always be careful in choosing a meter for noise measurements to ensure that the meter has a true-rms option. The standard laboratory meter (or VTVM) is less expensive. It’s usually an average-responding meter. If it’s used to measure noise, the meter reading must be multiplied by a correction factor. The correction factor depends upon the specifics of the noise. It won’t be discussed here. (20)A complete list of all types of noise is beyond the scope of this module. The following types of noise are those most likely to be found in a visible photodetector system: a. Johnson Noise: Any resistor acts as a generator of noise that is called Johnson noise. The mean square noise voltage is directly proportional to the value of the resistance. Johnson noise is sometimes called thermal noise. It occurs in all conducting materials. It’s a consequence of the random motion of electrons through a conductor. The electrons are in constant motion, but they collide frequently with the atoms or molecules of the substance. Each free flight of an electron constitutes a minute current. The sum of all these currents taken over a long period of time must, of course, be equal to zero. But their ac component is Johnson noise. b. Shot Noise: The term "shot noise" is normally associated with vacuum tubes in which the stream of electrons creates a noise due to the random fluctuations in the rate of arrival of electrons at the anode. This noise may be likened to the noise of a hail of shot striking a target. Hence the name shot noise. Shot noise is present in all photon detectors due to the random arrival rate of photons from the source of radiant energy under measurement and background radiation. This shot noise is often called "photon noise." Photon noise is the true ultimate limitation to detector performance. Even if all internal noise sources were eliminated, photon noise would set the ultimate limit for detector performance. In semiconductor diodes and photomultipliers, the shot noise associated with the random generation of carriers is the major noise source. In photoconductors the major source of noise is associated with both the generation and the ultimate recombination of the charge carriers. That is, it’s associated with the fluctuations in the rate at which charge carriers are generated and recombine. It’s often referred to as generation-recombination (g-r) noise. c. Excess Noise: At low frequencies, there are many types of noise for which the noise power varies inversely with frequency. A common term for this type of noise is 1/f (pronounced one over f) noise. It’s also known as excess noise since it exceeds shot noise at frequencies below a few hundred cycles. A variety of names are used to designate the 1/f noise associated with specific devices. It’s called modulation noise in semiconductors such as transistors, diodes, and detectors; contact noise in carbon-type resistors and their electrical contacts; and flicker noise in vacuum-tube cathodes. There are no simple mathematical expressions to describe these types of noise. In fact, some are not well understood to this day. The important consideration about these sources of internal noise is that any one or a combination of the noise currents will determine the lower limit of detectability of a photodetector system. (21)Now we have a basic foundation on the subject of noise. We can discuss how manufacturers of photodetectors rate their devices in terms of noise. This lets us compare different types of detectors based on their noise equivalent ratings. (22)The amount of optical power incident on the surface of a photodetector that produces a signal at the output of the detector just equal to the noise generated internally by the detector is the noise equivalent power (NEP). This is usually the minimum detectable signal level. (Signal-to-noise ratios less than 1 can be useful under some circumstances). Since, under these conditions, the signal power is equal to the noise power, we can say the signal-to-noise ratio is equal to one. Another equivalent way of stating NEP is to take the ratio of the total noise current to the responsivity at a particular wavelength. To calculate the signal-to-noise current ratio*, we need to know the output current produced by the radiation incident on a given area of the photodetector and also the noise currents from all sources. Recall that the major sources of noise are thermal and shot noise and that noise currents or voltages can’t be added but that noise powers add directly. We can calculate the rms value of signal current from the following equation:
(23)In dealing with several sources of noise, obtain the total noise by taking the square root of the sum of the square of the individual noise components. That is:
(24)If we measure the total power into the photodetector from the radiant source at the point at which the current signal-to-noise ratio at the output of the detector is unity, we can calculate the NEP. For is = RF e
For the example given above:
F e = = = Thus, the NEP = 5.77 ´ 10–1 2 watts (25)Note that the NEP normally is quoted by manufacturers using a measurement bandwidth of 1 hertz. The NEP increases as the square root of the measurement bandwidth. (26)It’s difficult to measure the signal when the signal-to-noise ratio is unity. So it’s customary to make the measurement at a high level of incident radiation and calculate the NEP from the following equation:
(28)A similar measure is often used to describe the performance of an entire system. It’s noise equivalent irradiance (NEI). NEI is the radiant flux density necessary to give an output signal equal to the detector noise. The NEI is given by the following equation:
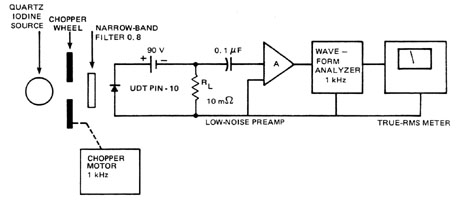
(30)A typical NEP measurement is shown in Figure 5. Initially, the total noise voltage at the frequency of 1 kHz and bandwidth determined by the waveform analyzer is read on the true-rms meter with the source blocked off. Next, you increase the radiant flux until the output reading equals two times the first reading. The NEP of the system, including the amplifier and analyzer, is the value of radiant power measured in watts incident on the detector. This may be an extremely small value and, therefore, difficult to measure. So, you can get the voltage S/N ratio at a higher level of radiation and make use of Equation 5 to determine the NEP.
Fig. 5
(31)The noise contributions of the preamplifier and waveform analyzer are less than the noise from the photodetector. If they were less, we could determine the detector NEP by simply taking the ratio of the detector noise current in amperes to the responsivity in amps/watt. (32)A preferable technique for measuring the relative contributions of the detector, preamplifier and waveform analyzer to the noise is to measure the noise at the output of the waveform analyzer. Measure first with the detector connected in the normal manner. Then measure with the detector replaced by a low-noise resistor of the same value as the detector. (33)You will have to judge, on the basis of these measurements, whether it will be necessary to correct the values of detector noise read on the meter to eliminate the effects of noise contributed by the instruments.
Detectivity (D) And D* (34)When we compare several photodetectors, the one with the highest output for a given radiation input is said to have the best responsivity. However, when we compare the detectors in terms of their detecting ability (that is, in terms of the minimum detectable radiant flux) the best detector is the one with the lowest NEP. If we take the reciprocal of the NEP, we can define a new term, called the detectivity. The higher the value of the detectivity, the better the detector. The detectivity (D) is a function of the following:
(35)The term, "chopping frequency," means that, during measurement of the NEP or D, the incident radiation usually is chopped or modulated at a fixed frequency and fed into a narrow-band amplifier at the output of the detector. The narrow-band amplifier is tuned to the chopping frequency. (36)The NEP—and hence the value of detectivity—depends on the area of the detector. This makes it difficult to compare the intrinsic properties of two different types of detectors. To remove this dependence, we use another term, called D* (pronounced "Dee-star"), to rate photodetectors. D* is given by the following equation:
(38)There’s a convenient way to remember the significance of D*. Recall that it is the signal-to-noise ratio when one watt of radiation is incident on a detector with a sensitive area of 1 cm2 and the noise is measured with an electrical bandwidth of 1 hertz. Thus, the term D* is a normalized detectivity that’s convenient for comparing the performance of detectors with different areas when used in circuits with different bandwidths. (39)It’s customary for manufacturers to write D* followed by three numbers in parentheses. Thus, D* (850, 990, 5) = 6.3 ´ 101 3 cm HZ1/2/watt means that the measurement was made at a wavelength of 850 nanometers at a chopping frequency of 900 hertz and a bandwidth of 5 hertz. If the bandwidth is unit, the last term is omitted, since unity bandwidth is implicit in the definition of D*.
Quantum Efficiency (40)Quantum efficiency (QE) is the ratio of countable events (such as photoelectrons or electron-hole pairs) produced by the incident photons to the number of incident photons. Note that it doesn’t include subsequent photons produced by amplification processes. If, over a period of time, an average of 10,000 photoelectrons are emitted as the result of the absorption of 100,000 photons of light energy, then the quantum efficiency will be 10%. Quantum efficiency is related to the responsivity as follows: It’s equal to the current responsivity times the photon energy in electron volts of the incident radiation. It’s normally expressed as a percentage. (Note, however, that responsivity sometimes includes subsequent gain.) Quantum efficiency is just another way of measuring effectiveness of the basic radiant energy in producing electrical current in a detector. It’s given by this simple equation:
(41)Note that the manufacturer has plotted the quantum efficiency (electrons/photon) curve as a function of wavelength as indicated in Figure 3. It’s interesting to note that the quantum efficiency of the dark-adapted human eye is a maximum of approximately 3% at a wavelength of 5100 Å. This means that the signal-to-noise performance of the eye is equivalent to that of an ideal detector that produces one recorded photo-event for each 33 incident photons within the wavelength band to which it is most sensitive. (42)For most material, the quantum efficiency is very low. But on the best sensitized commercial photosurfaces, the maximum yield may be as high as three photoelectrons for four light quanta. Another exception to the above statement is the avalanche photodiode. Here the quantum efficiency may exceed unity, since avalanche photodiodes provide internal gain and may deliver more than one electron for each photon of incident light.
Linearity (43)Photodetectors are characterized by a photocurrent response that’s linear with
incident radiation over a wide range. Any variation in responsivity with incident
radiation represents a variation in the linearity of the detector. In effect, we’re
saying that, if we plot the output current of the detector versus the input radiation
level, the slope of the line from the lowest level of radiation to the highest level of
radiation shouldn’t change. Noise in the detector or system will determine the lowest
level of incident radiation detectable. The upper limit of this input/output linearity
characteristic is established by the maximum current capability that the detector can
handle without becoming saturated (no change in output for a change in input). Linearity
may be stated in terms of maximum percent deviation from a straight line over a range
of input radiation levels. For example, it can be given as follows: Maximum deviation
from a straight line over the range of (44)Many factors may contribute to the deviations in linearity. Radiation levels in excess of the manufacturer’s stated maximum level may cause irreversible damage to the detector surface. In many cases, saturation of the detector response can occur at high light levels. A rating usually is given for the maximum allowable continuous radiation level for a given detector. If the radiation is in the form of a very short pulse, it’s possible to exceed the continuous level by a factor of ten or more without damage or noticeable changes in linearity.
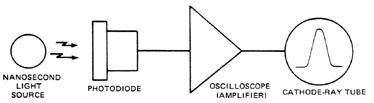
Response Time (45)If a constant source of radiant energy is instantaneously turned on and irradiates a photodetector, it will take a finite time for current to appear at the output of the device and for the current to reach a steady-state value. If the same source is now instantaneously turned off, it will again take a finite time for the current to follow the change and decay back to its initial zero level. The term "response time" normally refers to the time it takes the photocurrent generated by the detector to rise to a value that’s 63.2% of the final or steady-state value reached after a prolonged period of time. The "recovery time" is the time it takes the photocurrent to fall from its steady-state value to a value that is 36.8% of the steady-state value. (46)Photodetectors are apt to be used for detection of fast pulses. So, a more important term, called "rise time," is used to describe the speed of response of the detector. Rise time is the time difference between the 10% point and the 90% point of the peak amplitude output on the leading edge of the pulse. "Fall time" is measured between the 90% point and the 10% point of the trailing edge of the pulse waveform. This sometimes is referred to as the decay time. (47)The time measured between the first appearance of current and the appearance of radiation incident on the surface of the detector is called the "delay time." This time may be insignificant compared to the rise time. The time measured between the extinction of radiation incident on the detector and the first indication of a change in the current output is the "storage time." Adding the storage time to the fall time gives what is called the "turn-off time." (48)Rise-time and fall time are the most significant of these pulse response times. These are the two terms most often quoted by manufacturers in their literature. The rise time of a device that transmits or displays waveforms is taken as the rise time of the output (or displayed) waveform if the device were driven with a theoretically perfect step function (zero rise time). In practice, we use a source whose rise time is much less than the rise time of the device under tests. Ideally, we’d like to have a source with a rise time less than or equal to 1/10 of the rise time of the detector being tested. Another factor to consider is the rise-time limitation introduced by cables or of the display device, for example, the oscilloscope or recorder. As an example, if we fed a perfect step function into a detector and then an oscilloscope, we could determine the output rise time by the following empirical equation:
Fig. 6
(51)Response time in a photodetector is attributed to the transit time of photogenerated carriers within the detector material and the inherent capacitance and resistance associated with the device. It’s also affected by the impedance of the detector load and the impedance of the display device. There’s a trade-off to be made on selection of the load resistance for both fast response time and high sensitivity. It’s difficult if not impossible to achieve both. In general, fast response requires a low (50 ohms or less) load resistance, while high sensitivity requires a high-value load resistance. In each case, it’s important to keep any capacitance associated with the load or display device as low as possible. That’s because it’s the capacitance that will remove any high-frequency information in the signal being measured. In the case of photodiode detectors, it’s possible to control the junction capacity of the diode by varying the reverse bias across the cathode to anode. It has been found that the junction capacitance is approximately inversely proportional to the square root of the applied bias voltage. Typical values might be around 12 picofarads at 10 volts and 4 picofarads at 90 volts.
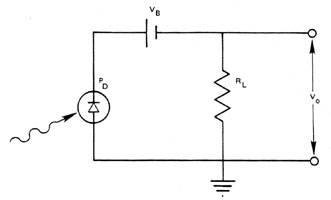
Silicon Photodiodes (52)In the Procedures Section, a silicon photodiode will be used as a tool to demonstrate measurement of some of these performance characteristics. Silicon has a band gap around 1.1 eV. Light with wavelength less than 1100 nm is absorbed in silicon and creates free hole-electron pairs. These current carriers are swept out of the silicon by an electrical field. The resulting current flow develops a voltage across a load resistor. The voltage is proportional to the incident light intensity. Hence the device acts as a photodetector. The basic circuit is illustrated in Figure 7. It shows a photodiode (PD) with light incident on it, an external bias voltage (VB) to drive the current carriers, and the external load resistor (RL). The photogenerated voltage is measured at the indicated position, by means of a voltmeter, an oscilloscope or a similar device.
Fig. 7
(53)The silicon photodiode is a simple low-cost device that responds in the visible and near-infrared portions of the spectrum. The response curve was shown in Figure 3. Because of its favorable characteristics, it’s often used as a detector for light from visible and near-infrared lasers. 
1. Define the following terms:
2. Describe the experimental setup for measuring NEP. 3. Explain the relationship between D* and NEP. 4. A silicon photodiode has a value of D* equal to 2 × 10 1 3 cm (Hz)1/2/watt, measured with a 1-Hz bandwidth, and an area of 0.05 cm2 . What is the NEP?5. A silicon photodiode has the response shown in Figure 3. What is the responsivity at a wavelength of 500 nm? At that wavelength, what’s the current output when 300 mW of laser radiation are incident on the detector? 6. A detector with a spectral responsivity shown in Figure 1 is irradiated by a signal that delivers 100 microwatts of power to the detector. The dominant noise sources are shot noise with an rms value of 300 pA and excess noise with an rms value of 10 pA. What’s the signal-to-noise ratio? 7. A photodetector output is fed into an amplifier and displayed on an oscilloscope. The amplifier/oscilloscope combination is known to have a rise time of 3 ns. The measured rise time of the combination of photodetector/amplifier/oscilloscope is 5 ns. What is the rise time of the photodetector? 
United Detector Technology (Photometer/Radiometer) Model 40A Opto-Meter, or equivalent power meter Silicon photodiode (UDT Model PIN-100 or equivalent) Set of 10 neutral-density filters, densities of 0.2 to 4.0 (Fish-Schurman, ND-419 or equivalent) Digital multimeter, 1 microvolt – 100 V, 0.1 na – 2 amperes (Keithley Instruments, Model 160/1602) with ac/dc probe True-rms voltmeter (Ballentine Model 320, Fluke Model 910A, Hewlett-Packard Model 3400A, or Keithley Model 121) 10-volt battery or regulated power supply Set of carbon resistors, 50 ohm to 10 megohm Low-noise amplifier (Tektronix Model 122, Keithley Model 103R, or equivalent) HeNe laser, 1 mW Argon laser, ³ 500 mW, tunable to at least four different visible wavelengthsMechanical chopper with photodiode pickup Waveform analyzer (Hewlett-Packard Model 302A, General Radio Model 1900A) 
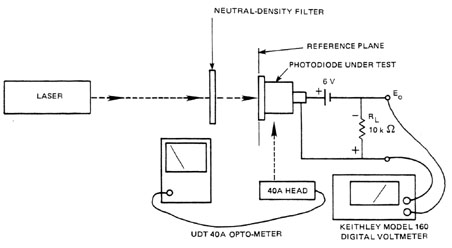
1. Figure 8 shows a setup used to measure the spectral response or responsivity of a photodetector. The standard of calibration will be a United Detector Technology, Model 40A Opto-Meter. For a more precise measurement, use a spectrally-flat thermopile calibrated in W/cm 2 from a standard lamp by the National Bureau of Standards. The reading of the Opto-Meter, when placed in the same reference plane as the photodiode, will indicate the number of watts at each wavelength. After measuring the radiation with the standard, the photodiode is put in place of the standard and used to measure the output voltage. Output current of the detector is determined from the measured values of output voltage and load resistance. Responsivity is calculated from the measured values at the wavelength of interest.
Fig. 8
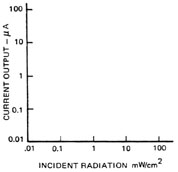
Measure the responsivity of a UDT PIN-10 photodiode at five different visible wavelengths with the circuit shown in Figure 8. Use the HeNe laser wavelength and four different wavelengths from the tunable argon laser. Plot the results on a graph of responsivity versus wavelength in microns, as shown in Figure 9. Compare your results with the manufacturer’s data. Maintain the signal current between the values of 5-50 m A to make sure the detector does not become saturated. Do not allow the incident power to exceed 500 mW at any time. A neutral-density filter may be required to prevent damage to the photodiode from excessive radiation.2. Insert a #1.0 ND filter in the space indicated in Figure 8. With the Opto-Meter at the reference plane, adjust the intensity of the argon laser, operating at 0.5145 m m, to get a reading of 10 mW on the meter. Replace the meter with the diode to be tested, and record the current reading in the table in Figure 10. Repeat the measurement with the following values of neutral-density filters: #2.0, 3.0, 4.0. In each case, also measure the power with the Opto-Meter. For the last reading, block off the detector under test and measure the dark-leakage current. Subtract this value from the signal current readings when the source is allowed to excite the diode. The leakage current should be somewhere around 0.5 m A, or lower. Very quickly, take a reading of the photodiode current when all neutral-density filters are removed. Don’t measure this power density with the Opto-Meter, but record it as ten times the first reading with the ND 1.0 filter. Plot the tabulated results in Figure 10. Determine the power level at which the detector response departs from linearity.
Fig. 9 3. Using the circuit shown in Figure 5, measure the current signal-to-noise ratio for the photodiode when the incident radiation level is from a HeNe 1-mW laser. Replace the quartz lamp by the laser. Determine the power output of this laser using the Opto-Meter. Measure the noise voltage at a chopping frequency of 1 kHz and a bandwidth determined by the waveform analyzer. Read the results on the true- rms meter with the laser blocked off.
Fig. 10
(54)Next, allow the laser light to strike the detector. Increase laser power until the output reading equals two times the first reading. The NEP is the value of the radiation measured in watts incident on the detector. This may be a very small value, difficult to measure. Thus you may instead measure the voltage signal-to-noise ratio at a known higher level of radiation (measured with the Opto-Meter). Then use Equation 5 to determine the NEP. (55)The area of the detector may be determined from the manufacturer’s specifications. Finally, determine the value of D* (Equation 7). Compare the results with those quoted by the manufacturer for NEP and D*. 
Budde, W. Optical Radiation Measurements. Vol. 4, "Physical Detectors of Optical Radiation." New York: Academic Press, 1983. Kruse, P.W., L.D. McGlauchlin, and R.B. McQuistan. Elements of Infrared Technology. New York: John Wiley & Sons, 1962. Lee, T.P., and T.L. Li. "Photodetectors" (Chapter 18), Optical Fiber Telecommunications. S.E. Miller and A.G. Chynoweth, ed. New York: Academic Press, Inc., 1979. McCormick, M. "Infrared Detector Update." Electro-Optics, June 1983, pp. 62-69. Ready, J.F., Industrial Applications of Lasers. New York: Academic Press, 1978. --------------------------------------------------------------
|
||||||||||||||||||||||||||||||||||||||||||||||||||||||||||||||||||||||||||||||||||||||||||||||||||

 Note: R = 0.4 A/W at
0.7 m m
Note: R = 0.4 A/W at
0.7 m m