| This version reflects the comments of the core participants as reviewed and incorporated in accordance with CORD's FIPSE-supported Curriculum Morphing Project. | |||||||||||||||||||||||||||||||||||||||||||||||||||||||
MODULE 10-3 INTRODUCTION In passing through a translucent material, whether solid or liquid, a beam of light loses some of its original intensity, i.e., part of the light intensity gets through and part does not. In absorption spectrophotometry, one is concerned with the determination of the amount of light intensity that does not get through, i.e., the part that is absorbed. A graph of the corrected light absorption as a function of wavelength is called an absorption spectrum of the material under study. In this module, we will deal with the techniques to obtain the absorption spectrum of the dye rhodamine 6G.
MODULE PREREQUISITES Before studying this module, the student should have a basic knowledge of algebra and common logarithms, as well as a knowledge of the safety precautions to be observed in the laboratory. Furthermore, knowledge of the use and care of grating monochromators and of phototubes is required. For a better understanding of this module, it is essential that the student have completed Module 5-6, "Nuclear Fuel Cycle"; Module 5-7, "Neutron Monitoring Systems"; Module 6-9, "Gratings"; Module 10-1, "Spectrometers"; and Module 10-2, "Monochromators." It is desirable but not essential that the student have knowledge of Module 3-10, "Optically Pumped, Pulsed Solid Lasers."
Upon completion of this module, the student should be able to: 1. Explain the basic equipment and techniques used to obtain the absorption spectrum of a liquid. 2. Explain the relationship between % transmission, absorbance, and molar absorptivity. 3. Explain the relationship between % transmission and cell length and concentration. 4. Experimentally determine the % transmission and the absorbance as a function of wavelength for rhodamine 6G dye. 5. Experimentally confirm the Lambert-Beer law by measuring the absorbance for two different concentrations of rhodamine 6G. 6. Calculate the molar absorptivity of rhodamine 6G as a function of wavelength.
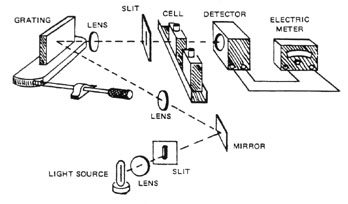
When light containing many different wavelengths propagates through a substance, some of the light may be absorbed, the rest being transmitted (or reflected). A substance appears colored because part of the visible light is absorbed. For example, a solution of cupric ions appears blue because, when white light is passed through it, the red and yellow light are absorbed, and only the blue is transmitted. The wavelengths at which absorption occurs, as well as the amount of absorbed light, is characteristic of a substance. The instrument used for making quantitative measurements of the transmission of light at various wavelengths is a spectrophotometer. Spectrophotometers contain the following principal parts (see Figure 1):
Fig. 1
Spectrophotometers may be divided into one-beam and two-beam instruments, and also into types using a prism or diffraction grating in their monochromators. The band of wavelengths of the light passing through the sample depends upon the dispersion of the prism or grating and the slit widths. The narrower the slit widths, the more monochromatic the radiation and the greater the resolution. The spectral ranges of these instruments also differ—being extended by the use of quartz prisms and other special materials and equipment into the ultraviolet and infrared. By such methods, including the use of two different light sources, some instruments cover the range from 2000 to 10,000 angstroms. The cell compartment contains one cell filled with the solution to be studied and a second identical cell filled with a reference solution, usually pure solvent. In the one-beam spectrophotometer, such as the one to be used in this module, one cell is placed in the optical path, and then the other. The magnitude of the electric current from the detector is proportional to the intensity of the transmitted light. In an experiment, a cell containing solvent only is put in place between the exit slit of the monochromator and the detector. The gain of the detector amplifier is adjusted so that a full-scale (100%) reading is obtained. Some light incident upon the cell is lost by reflection or by absorption by the glass of the cell of solvent. However, these losses will be the same for the cell containing the solution, which is next inserted between the slit and detector. Assuming that the response of the detector is directly proportional to the light intensity, the reading now gives the percentage transmission of the solution. The transmittance can be measured for the new wavelength by turning the prism or grating so that light of another wavelength passes through the reference cell of solvent, adjusting the detector gain to obtain a 100% reading, and then making a reading on the solution cell. By repeating this procedure, the transmittance can be mapped over the UV, visible, and near infrared regions. In dual-beam spectrophotometers, the plots are recorded automatically. Recently developed microcomputer-controlled spectrophotometers provide full spectrum analysis in seconds. They measure and display the full spectrum on a cathode-ray tube in one second—greatly reducing the time per analysis. For example, the Perkin-Elmer Model 1300 series is a microprocessor-controlled infrared spectrophotometer that can be used for industrial quality control, routine analytical applications, and in a variety of teaching environments. It features a single slit program and two scan speeds. For quality-control studies, there is a parameter memory accessory whereby the wavenumber drive will slow up to 30 preselected wavenumber locations and will take readings at each position. The instrument also features a self-diagnostic general instrument checkout routine and can diagnose incorrect operation or component failure. Our prime concern in this module will be with a spectrophotometric measurement of the absorption spectrum of a dye suitable for use as a laser material. The dye to be examined is rhodamine 6G which has been introduced earlier in Module 3-10, "Optically Pumped, Pulsed Solid Lasers." The dye will be placed in a liquid solution and its absorption spectrum measured. The equipment required to obtain an absorption spectrum consists primarily of the following:
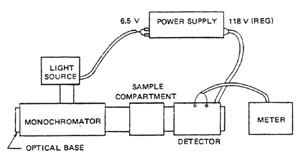
In the present experiment, these requirements are met by the Welch Chem-Anal system. The source of light will be a tungsten lamp, the wavelength selector, a monochromator, the detector, an RCA 934 phototube with an amplifier, and a meter indicator. The intensity of the incident radiation can be adjusted by using the zero and reference controls on the Chem-Anal Detector. All of these units have already been used in Module 10-2, "Monochromators." In this module, a new element—the sample compartment—is added between the monochromator and detector on the optical base. This overall arrangement is shown in Figure 2.
Fig. 2
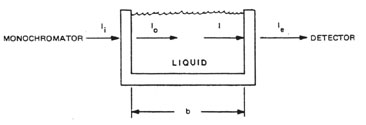
Light from the tungsten source is incident on the entrance slit of the monochromator and is dispersed by the grating. The particular wavelength (20-nm bandwidth) of light is then chosen with the wavelength dial, passed through the dye sample in the sample compartment, and detected by the 934 phototube. The transmitted intensity is read on the meter. The sample chamber has provisions for holding four 1-cm square absorption cells or "cuvettes." A selector knob on the top of the compartment permits placement of each of the cells in the light path. There is also a provision for blocking the light path to the detector (by placing the selector knob at zero). This position is used to stimulate zero transmittance. To determine the absorption spectrum, one measures the incident intensity and the transmitted intensity of the light passing through the cell containing the liquid. This is shown schematically in Figure 3.
Fig. 3
Ii is the intensity of the light of wavelength l that leaves the monochromator, Io is the intensity of the light that enters the dye, I is the intensity of the light that leaves the dye, and Ie is the intensity of the light that enters the detector. Io will be slightly less than Ii due to the fact that a small amount of light will be reflected, scattered, and absorbed by the cell wall as the beam passes through it. I will be less than Io due to the absorption (we neglect scattering) by the molecules of dye in the cell itself. Passage of the light through the second cell wall also will be accompanied by some reflection, scattering, and absorption, thus Ie will be less than I. In practice, one makes the absorption measurement in the following manner: The monochromator is set to pass a particular wavelength. The light path to the detector is blocked and the meter is set at 0.0 transmission with the zero adjust knob. An absorption cell containing the solvent that is used in making the dye solution is placed in the light path. The detector amplifier gain is adjusted with the reference control so that the meter reads 100% transmission. A second absorption cell, identical to the first but containing the dye solution, is placed in the beam path and the % transmission recorded. Since the 100% transmission point was set with cell plus solvent in the beam path, the measured % transmission of the second cell represents the transmission of the dye alone, i.e., the effect of reflection, absorption, and scattering at the cell walls and in the solvent has been effectively eliminated. Thus, the fraction of the light transmitted T (called the transmittance) is given by Equation 1.
or the transmission by Equation 2:
To determine the %T as a function of wavelength, one must repeat this procedure for each wavelength. In this way, a curve of %T versus wavelength can be obtained.
Let us next see how the transmittance is related to the length of path through the dye
and to the dye concentration. Consider a dye cell of length b1. In this
length, the incident light intensity Io will be reduced by some fraction
f to I1, i.e., I1 = fIo. If
the path length is doubled, the intensity I1 will be further reduced by
the fraction f to I2, i.e., I2 = f 2Io.
For n thicknesses (each of length b1), we obtain I = In
= f nIo, or
where: n = The ratio of total path length b to incremental path length b1. Furthermore, since the transmittance is affected by the concentration of dye in the solvent, it is necessary to introduce the concentration into the equations. To do this, consider the following argument: Suppose one has a dye cell with length b = 2b1, thus I = f 2Io. The cell contains solvent with concentration c1 of dye in solution. If one could now reduce the thickness of the cell to one-half its original thickness while at the same time evaporating one half of the solvent, we would have a cell length b1 but with double the concentration, i.e., 2c1. Since no dye was removed, this half-cell of length b1 and concentration 2c1 must absorb in exactly the same way as the cell of length 2b1 and concentration c1. Likewise, doubling the concentration while maintaining constant length will have the same effect as doubling the length and holding the concentration the same. Thus, if both concentration and length are included, n = bc/b1c1. Introducing this into Equation 3, we obtain Equation 4.
Here (log10 f) b1c1 is a constant, the negative of which is defined as the molar absorptivity a; that is:
Using the molar absorptivity a, Equation 5 becomes Equation 6.
From Equation 1, T =
The quantity log10 (
Thus, by measuring the transmittance T of a substance, one can calculate the absorbance A. Since b, the length of the cell, is a known constant, one also can, with the help of the Lambert-Beer law, calculate the absorptivity a if c is known, or the concentration c if a is known. Note that the molar absorptivity a is a constant independent of cell length and solution concentration. Values of the molar absorptivity are found in various reference books. From these values and a spectrophotometer measurement, the concentration of a solution is found. This is a standard procedure used in many laboratories.
1. The percentage transmittance of a solution of sodium fumarate in water at 250 nm and 25°C is 19.2% for a 5 ´ 10–4 molar solution in a 1-cm cell. Calculate the absorbance and the molar absorptivity. What is the percentage transmittance of a 1.75 ´ 10–4 molar solution? 2. When a 1.9 -cm absorption cell was used, the transmittance of the light at a wavelength of 435 nm by bromine in carbon tetrachloride solution was found to be as follows:
Calculate the molar absorptivity. What percentage of the incident light would be transmitted by 2 cm of solution containing 0.00155 mole of bromine per liter of carbon tetrachloride? 3. A solution of a dye containing 1 g per 100 milliliters transmits 80% of the blue light at 435.6 nm in a glass cell 1 cm thick. What percent of light will be absorbed by a solution containing 2 g per 100 milliliters in a cell 1 cm thick? What concentration is required to absorb 50% of the light? Consider the following application of a spectrophotometer: A police officer swabs a suspect’s hands, and sends the swabs to the crime lab for analysis. Barium (Ba) and antimony (Sb) are usually present in gunpowder. An atomic absorption spectrophotometer with furnace atomizer detects the presence of 0.43 µg of Ba and 0.09 µg of Sb. Conclusion: There was gunshot residue on the hands of the suspect. List some other applications of spectrophotometers.
Welch Chem-Anal system (tungsten source, monochromator, detector, meter, sample compartment, optical mount, and power supply) Rhodamine 6G dye Methanol (1 liter) Two glass cuvettes (1-cm path length)
In this experiment, the student will determine the % transmission and absorbance of rhodamine 6G dye as a function of wavelength. Since the heart of this experiment is the Welch Chem-Anal system, the student should read Pages 28 through 30 of the Chem-Anal manual before beginning. The experimental arrangement for this measurement is that shown in Figure 1. The monochromator, sample compartment, and detector are mounted on the optical base. The light source is mounted and aligned as was described in Module 10-2, "Monochromators." Power should be applied to the detector and the system allowed to warm up for at least 10 minutes. The monochromator, sample compartment, and detector then should be moved laterally on the optical base to obtain good optical alignment. This is done by observing the meter reading as the elements are moved and by maximizing this reading. 1. Open the sample compartment. Inside you will observe a four-position rotary "cuvette" holder which is used to reproducibly position the "cuvettes" (or absorption cells) in the beam path between the monochromator exit slit and the detector. Each of the four cuvettes can be rotated into the beam path using the knob on top of the sample compartment. The reproducibility of the positions is ensured by the use of a "detent" groove at each position. Note that if the knob is turned to the "zero" position, the light from the monochromator is blocked. This position is used to set the meter reading at 0.0% transmission. 2. Prepare a 10–4 molar solution of rhodamine 6G dye in methanol. The molecular weight of this dye is 449 g. Thus, to achieve the proper solution, dissolve 10–4 ´ one molecular weight of rhodamine 6G dye in methanol to make one liter of solution. Clean two cuvettes. See the Welch Chem-Anal manual for the general cuvette cleaning techniques (p. 32). Note well: Improper cell handling will introduce considerable error into your measurement. Clean cells carefully; never use a cell with fingerprints or spilled solution on the outside. Place the rhodamine 6G solution in one cell and methanol in the other. Place the two cells into the rotary cell holder in the sample compartment. The cell containing methanol is the reference. 3. You are now ready to take your data. The procedure is as follows:
Note that the meter contains two scales—a linear scale for % transmission and a logarithmic scale for absorbance. These two scales are related by Equation 7. 4. Plot two curves from this data, one representing the %T as a function of wavelength, the other representing the absorbance as a function of wavelength. These two curves can be plotted on the same sheet of graph paper using two different scales on the ordinate. 5. Using Equation 7, determine the molar absorptivity at each wavelength. Plot molar absorptivity as a function of wavelength. This is a particularly useful curve since molar absorptivity depends on the molecular structure of the dye but is independent of cell length and solution concentration. 6. In order to test the Lambert-Beer law, prepare a 0.5 ´ 10–4 molar solution of rhodamine 6G in methanol. Measure the absorbance of this solution at several different wavelengths such as 490 nm, 530 nm, and 550 nm. Compare these values with those obtained from the 10–4 molar solution. Do your results agree with those predicted by Equation 7?
Duclos, J. Computerized UV-VIS Spectroscopy,; American Laboratory. p. 133, Nov. 1980. Edisbury, J. R. Practical Hints on Absorption Spectrometry. New York: Plenum Press, 1967. Hilton, W. A. Experiments in Optical Physics. 3rd ed. Copies may be purchased from Dept. of Physics, William Jewell College, Liberty, MO 64068. Copyright 1974. Pinkerton, R. C. "Beer’s Law Without Calculus." Journal of Chemical Education. Vol. 41, 1964, p. 366. Sawyer, R. A. Experimental Spectroscopy. 3rd ed. New York: Dover Publications, Inc., 1963. Snavely, B. B. "Flashlamp Excited Dye Lasers." Proc IEEE. Vol. 57, p. 1374. 1969. Zimmerman, J. and Haenisch, E. Welch Chem-Anal Manual. Sargent-Welch Scientific Co. (Catalog #4883 M). Information on spectrophotometers also may be obtained from the following manufacturers:
--------------------------------------------------------------
|
|||||||||||||||||||||||||||||||||||||||||||||||||||||||