| This version reflects the comments of the core participants as reviewed and incorporated in accordance with CORD's FIPSE-supported Curriculum Morphing Project. | ||||||||||||||||||||||||||||||||||||||||||||||||||||||||||||||||||||||||||||||||||||||||||||||||||||||||||||||||||||||||||||||||||||||||||||||||||||||||||||||||||||||||||||
MODULE 10-1 INTRODUCTION An optical instrument used to measure the wavelengths or frequencies of light emitted by various light sources is commonly known as a spectrometer or spectrograph. In the former case (spectrometer), the emphasis is placed on using the instrument to measure the different wavelengths of the light while in the latter case (spectrograph), the emphasis is placed on using the instrument to record or photograph the spectrum. If the instrument is simply used to visually observe the spectrum of a light source, it often is referred to as a spectroscope. Regardless of the manner in which this particular optical instrument is used, its construction is essentially the same. All spectrometers depend on an important optical element, usually a prism or grating, to separate the light into its individual colors or wavelengths. Once separated, the different wavelengths can be recorded and measured. In this module, we shall concentrate on spectrometers. The essential makeup of both prism and grating spectrometers will be studied. Each type of instrument will be used to measure the wavelengths of light from certain spectral sources. Since such measurements generally require careful alignment and calibration, the student will be introduced to these procedures. In addition, certain performance characteristics of spectrometers, such as resolving power and dispersive power, will be defined and calculated for both grating and prism spectrometers. The module is divided into two parts, one part describing prism spectrometers and the other describing grating instruments. MODULE PREREQUISITES The principles of operation of spectrometers are more understandable if the student is familiar with the material covered in previous modules on refraction and diffraction of light. In particular, the student should review the ideas presented in Module 5-4, "Reflection and Refraction"; Module 5-7, "Diffraction"; Module 6-7, "Prisms"; and Module 6-9, "Grating." A brief review of the principles developed in Course 2, "Geometrical Optics," will also be helpful, especially the ideas presented in Module 2-5, "Imaging with a Multiple Lens" and Module 2-6, "F-Stops and Apertures." The mathematics of algebra and trigonometry is sufficient to develop an understanding of the theory and operation of spectrometers. 
Upon completion of this module, the student should be able to: 1. Demonstrate a knowledge of spectrometers by writing statements explaining the functions of each of the following components of a given prism spectrometer and of a given grating spectrometer.
2. Define resolving power and dispersive power for both prism spectrometers and grating spectrometers. Definitions should indicate procedures necessary to calculate resolving power and dispersive power of both types of spectroscopes. 3. Following a given procedure, set up and align a prism spectrometer for use in the measurement of refractive index and wavelength. 4. Measure the index of refraction of a glass prism at several different wavelengths, and plot the dispersion curve for this glass prism. Using this dispersion curve, determine the resolving power and the dispersive power of the prism and estimate the values for nF, nC, and nD as defined in the text. 5. Measure the wavelengths of an unknown light source by using both a prism spectroscope and a grating spectroscope and by following the procedures outlined in this module. 
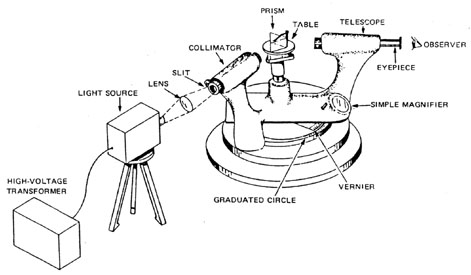
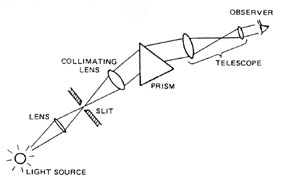
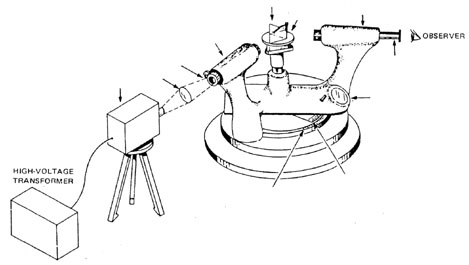
Prism Spectrometer The Instrument An instrument composed of a collimator, a prism table, and a telescope is called a prism spectrometer. See Figure 1. A simple schematic of the optical device is shown in Figure 2. The operation of the spectrometer is described as follows: Light enters through a slit at one end of the collimator and emerges parallel to the axis of the collimator at the other end. The collimated light then strikes a prism that has been appropriately positioned on the spectrometer table. The prism deviates and disperses the collimated light according to Snell’s law and the different wavelengths of light present in the light source. The sets of parallel rays (one set for each wavelength) then enter the telescope and form separate, distinct images of the collimator slit when viewed through the telescope. Cross hairs in the telescope may be positioned over each spectral line, thereby fixing the angular position of the telescope for each wavelength. The angular position of the telescope is determined with the aid of the circular scale, which is graduated in fractions of a degree. Thus, a direct relationship exists between the position of the telescope and a given wavelength of light passing through the prism. It is this relationship that permits the prism spectrometer to be used to measure the wavelength of any given spectral light component.
Fig. 1
Fig. 2
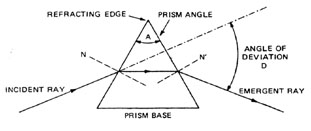
Simple Theory As a ray of monochromatic light passes through a prism, it is refracted twice, once as it enters and again as it leaves the prism, as shown in Figure 3.
Fig. 3
The angle A between the two prism surfaces or planes where refraction takes place is called the prism angle. The intersection of the two refracting planes is called the refracting edge of the prism. The base of the prism is that side of the prism opposite the prism angle. (This name may be misleading; it is important to realize that the prism does not rest on the base during normal operation.) The normals to the prism faces are shown as N and N ¢ . As the figure clearly shows, the incident and refracted rays are in different directions; the angle D between the incident and emergent rays is defined as the angle of deviation. As we already know, if a beam of collimated light containing several wavelengths is incident on the prism face, different wavelengths will be refracted by different amounts and will, therefore, necessarily have different angles of deviation. The particular angle of deviation depends on the prism angle, the index of refraction of the prism at that wavelength, and the angle of incidence. The angle of deviation D is a minimum if the angle of emergence is equal to the angle of incidence, a condition that can be easily achieved with a prism spectrometer. When the prism spectrometer is set at minimum deviation for a given wavelength, it can be shown that the indices of refraction nl (at that wavelength) are given by Equation 1.
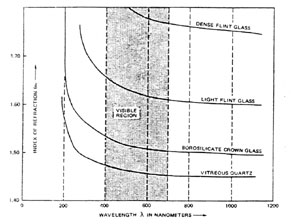
By determining the angle of minimum deviation for each wavelength, one can calculate the appropriate nl (for the wavelength l ) from Equation 1. The graph of index of refraction versus wavelength is called a dispersion curve. Several dispersion curves are shown in Figure 4.
Fig. 4
Dispersion, Dispersive Power and Resolving Power From the dispersion curves for different optical materials shown in Figure 4, it can be seen that the index of refraction nl varies with the wavelength l . In fact, it is clear that the index of refraction decreases as the wavelength increases, and that the rate of decrease is less at longer wavelengths. For example, for borosilicate crown glass, the index of refraction decreases rapidly between 200 and 300 nm, while it decreases only gradually between 500 and 600 nm. This rate of change of index of refraction with wavelength is called dispersion and can be written as D n/D l . The relative dispersion or dispersive power, DP, of a prism in the visible region is defined as follows:
Typical values for the dispersive power are 0.02 for crown glass (low dispersion) and 0.033 (high dispersion) for flint glass.
The resolving power of a prism is defined as the ratio of the wavelength l to the minimum wavelength difference that can be distinguished at the wavelength. Thus
It can be shown that for a prism, the resolving power (RP) is given by Equation 4.
Note, therefore, that the resolving power of a prism spectrometer depends on how big the base of the prism is (B) and what type of glass (D n/D l ) is used in the prism. In concluding this section on simple theory, it might be worthwhile to mention that glass prisms serve quite well for prism spectrometers used in the visible region. In the ultraviolet region, quartz or fluoride prisms are required, while in the infrared region, alkali halides (e.g., rock salt) or sapphire prisms are usually employed. Table 1 gives the most suitable prism materials for different parts of the optical spectrum. Table 1. Optical Spectrum Prism Materials
Grating Spectrometer The Instrument A grating spectrometer is in every way similar to a prism spectrometer (such as the type shown in Figure 1) with the exception that a simple, plane diffraction grating replaces the prism as the dispersing element. The function of the collimator and telescope, as well as the general operation of the spectrometer, remains unchanged.
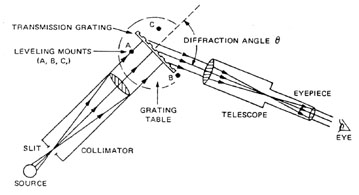
Simple Theory The diffraction grating is a simple and most useful instrument for studying spectra. The grating consists of a grid of fine parallel lines uniformly spaced on a polished reflecting or transmitting surface. The lines generally are ruled with a fine diamond point and generally number several thousand lines per centimeter. The reflection or transmission of light, by the uniformly separated portions of the surface, causes diffraction and interference effects, as discussed in Module 5-6, "Interference" and Module 5-7, "Diffraction." These effects lead to the formation of a spectrum characteristic of a given light source. The essential makeup of a grating spectrometer is shown in Figure 5. The similarity between this arrangement and that of the prism spectrometer is readily apparent.
Fig. 5
The collimator directs parallel light onto the grating. The grating, in turn, serving as the dispersing element, separates the bundles of parallel light of different wavelengths and directs them into the telescope. The observer adjusts the telescope for proper focus and views the characteristic line or band spectrum of the source in the focal plane of the telescope. The diffracting angle q shown in Figure 5 is unique for each wavelength of light in the light source. As described in Module 5-7, "Diffraction," the wavelength of light l , the diffracting angle q , the grating constant d, and the order number m are all related in the grating equation.
The collimated beam illustrated in Figure 5 is perpendicular to the plane of the grating so that for this orientation angle i is zero and sin i is zero. Thus, for normal incidence, the grating equation reduces simply to Equation 6.
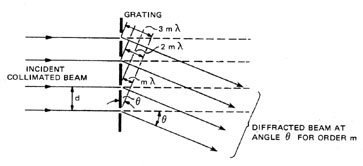
The essential geometry relating l , q , and d for order m is illustrated in Figure 6.
Fig. 6
Thus, for a given order other than the zeroth order (m = 0), the incident light is diffracted at an angle q given by sin q = (ml )/d. Since d is the grating constant and m is constant for a given order, the angle q changes with wavelength. For each other (m = 1, 2, 3, and so on), the different wavelengths are separated out and observed as a distinct spectrum. However, since spectral lines in adjoining orders may overlap, one must be careful in interpreting the spectral lines observed in the focal plane of the telescope. For example, a red line of 700-nanometer wavelength in third order is diffracted through the same angle as the green line of 525-nanometer wavelength in fourth order since sin q = 3(700)/d = 4(525)/d is identical for each wavelength. For visible light, there is no overlapping of the first and second orders since, with l 1 = 720 nm and l 2 = 400 nm, the red end of the first order falls just short of the violet portion of the second order. When photographic observations are made, however, these orders may extend down to 200 nm in the ultraviolet, and then the first two orders do overlap. One can avoid this complication through the use of suitable color filters to absorb the wavelengths from the incident light that would overlap the region under examination. For example, a cutoff filter that transmits only wavelengths longer than 600 nm might be used to block the shorter wavelengths at order m = 2 or higher from disturbing the observations in the wavelength region near 700 nm. In any case, a little common sense and attention to color, where orders do overlap, will help in avoiding incorrect identification of wavelengths in unknown spectra. In some cases, it is desirable to use the overlapping order lines as wavelength standards for more exact assignment of unknown lines.
The linear dispersion D l /D l is a useful parameter that describes the ability of the grating spectrometer to separate spectral lines. For example, a grating spectrometer whose linear dispersion is 0.25 mm/Å is obviously superior to one whose linear dispersion is 0.06 mm/Å in the same region, since the ability is about four times that of the second. The equation for linear dispersion is given by Equation 7.
Since linear dispersion does depend on the diffraction angle q , one cannot quote a value for the linear dispersion of a spectrometer that is valid at all wavelengths. However, one still can compare different spectrometers by calculating D l /D l in the middle of the visible spectrum (say 550 nm in the first order) for each spectrometer. The resolving power of a grating spectrometer, just as the resolving power of a prism spectrometer, is obtained from the basic definition of l /D l . It can be shown that for a grating spectrometer, the resolving power is given by Equation 8.
Thus, for a grating that contains 10,000 lines, the resolving power in second order is 2 ´ 10,000, or 20,000. This means that at 500 nm, the grating used in second order theoretically can resolve spectral lines differing in wavelength by D l = 500 nm/20,000, or 0.025 nm. Used in first order, the resolving power would be cut in half (i.e., 10,000). In this case, the grating could separate spectral lines differing in wavelength by ~ 0.05 nm.
Types of Gratings A few words about the different types of gratings are in order at this point. A transmission grating is distinct from a reflection grating. In the former, the lines are ruled on glass, the unruled portions acting as the slits; in the latter, the lines are ruled on a polished metal surface and the incident light is reflected from the unruled areas, producing by reflection the same result as that by transmission through the transmission grating. Depending on the shape of the ruled surface, one can also distinguish between plane and curved gratings. Clearly curved reflection gratings have a focusing capability, depending on the radius of the curvature of the surface, which will be superimposed on the diffraction effects of the grating itself. In some instances, one may have occasion to use or order a so-called blazed grating. In a blazed grating, the grooves cut into the surface are given a particular, regular geometrical shape, causing most of the diffracted light energy to be concentrated in a certain direction. When grating grooves are made in the triangular, staircase (echelette) shape as shown in Figure 7, the reflected light is concentrated in one direction or order. To the observer’s eye, the grating appears to light up or "blaze" as it is being rotated, giving only faint spectral images in any of the other possible orders. Referring to Figure 7, it may be seen intuitively that the incident light will be diffracted at optimum intensity along the direction labeled "specular reflection." The wavelength that coincides with the intensity peak is known as the blaze wavelength. Most modern gratings are of the shaped or blazed variety. Their significance lies in the fact that they shift energy out of the useless zeroth order into one of the higher-order spectra.
Fig. 7
Student-type prism grating table spectrometer with accessories Ordinary gooseneck lamp Mercury discharge lamp with high-voltage transformer Sodium discharge lamp with high-voltage transformer Hydrogen capillary discharge lamp with high-voltage transformer Nitrogen capillary discharge tube with high-voltage transformer
Prism Spectrometer Acquaint yourself with the parts and construction of a prism spectrometer such as the one shown in Figure 1. Examine the spectrometer and locate the collimator, the adjustable entrance slit, the prism table, the telescope, the graduated scale and vernier, and all clamps. The spectrometer is a delicate and expensive instrument that must be handled with care. All movable parts such as the prism table and telescope move freely if the proper clamps are loosened. NEVER FORCE ANYTHING.
Adjustment of the Spectrometer for Parallel Light Normal operation of the spectrometer requires parallel light emerging from the collimator, passing through the prism and entering the telescope. Therefore, the collimator must be adjusted to produce parallel light and the telescope adjusted to receive parallel light. 1. Before placing the prism on the table, aim the telescope at a distant object through a window. Rotate the knurled ring close to the eyepiece so that the eyepiece moves in and out. (You may have to slide the eyepiece in and out on some models.) Bring the image of the distant object into clear focus in the plane of the cross hairs (focal plane of the telescope). The telescope now is adjusted for parallel light; do not further change the focus of the telescope after this adjustment. 2. Next, adjust the collimator for parallel light. With the proper clamp loosened, bring the telescope into a straight line with the collimator. By turning the knurled ring at the end of the collimator, slightly open the adjustable slit. Place an incandescent light source (such as a gooseneck lamp) in front of the slit and look through the telescope. Slide the tube that holds the slit in and out of the barrel of the collimator and, if necessary, move the telescope sideways a little until a sharp image of the slit is seen in the center of the focal plane of the telescope. Set the slit exactly vertical. The collimator now is set to produce parallel light and should not be further disturbed.
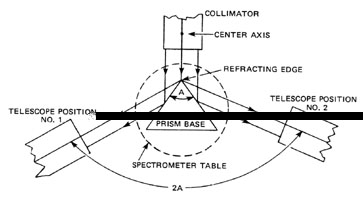
Measurement of the Prism Angle A 1. Place the prism on the table of the spectrometer so that its refracting edge is vertical and faces the collimator as shown in Figure 8.
Fig. 8
2. Move the telescope (position #1) until the collimator slit image, reflected off one of the prism faces, is visible in the telescope. Carefully position the telescope until the slit image is in the center of the focal plane of the telescope and the cross hair is aligned with one edge of the slit image. Read and record the angular position of the telescope on the graduated scale, making use of the vernier to obtain maximum accuracy. 3. Swing the telescope around to receive the light reflected off the other face of the prism (position #2). (When rotating the telescope, push on the supporting arm rather than on the telescope itself.) Align the cross hair with the same edge of the slit used in position #1. Read and record the angular position of the telescope. The difference in readings of the two angular positions is equal to twice the prism angle (2A). Divide this reading in half to obtain the desired prism angle A.
Measurement of the Angle of Minimum Deviation 1. Turn on a mercury lamp source. OBSERVE ALL SAFETY PRECAUTIONS FOR WORKING WITH INTENSE ULTRAVIOLET LIGHT. After the mercury lamp has brightened to its highest intensity (several minutes), set the lamp near the slit end of the collimator. With clamps loosened, swing the telescope around in line with the collimator (position #1 in Figure 9). With the prism removed, center the slit image in the focal plane of the telescope. Make the slit fairly narrow, but not so narrow that a single-slit diffraction pattern occurs.
Fig. 9
2. Read and record the angular position of the telescope. 3. Place the prism on the spectrometer table so that one face makes an angle of about 45° with the light coming from the collimator. At the same time, ensure that the collimator light fills the face of the prism. Look through the telescope while moving it around slowly, until the colored images of the collimator slit are seen. Align the cross hair of the telescope on one of the spectral lines, say the very bright green line (546.1 nm). The location of the telescope now would be roughly that of position #2 in Figure 9. 4. To find the position of minimum deviation, the prism table is rotated slowly (loosen the table clamp!) in the direction that causes the image of the green line to move toward the first position of the telescope, that is, toward the undeviated direction. Follow this image with the telescope until a position is found where the image just reverses its motion. Repeat this several times until the turn-around point is clearly determined. This is the direction of minimum deviation for the green line. Carefully align the cross hair on one of the spectral lines and read the angular position of the telescope. The difference between this reading and the reading for the undeviated direction (with telescope at position #1) is equal to the angle Dmin shown in Figure 9. Now with information on angle A and angle Dmin, the index of refraction of the glass prism, at the wavelength corresponding to the spectral line viewed above, can be calculated from Equation 1. The procedure outlined above can be repeated for each line visible in the spectrum, thereby obtaining a value of nl for each wavelength.
Plot of Dispersion Curve for a Given Prism 1. Determine the prism angle A for the prism provided, following the procedure outlined previously. The prism should be moved several times and the procedure repeated. The average of the readings should be used for angle A. 2. With a mercury lamp as a light source, determine the angle of minimum deviation for each of ten of the more intense spectral lines. Calculate nl versus l for the ten lines, drawing the best smooth curve through the ten data points. Table 2 lists eighteen of the more intense spectral lines from a mercury lamp. Most of the lines are due to mercury atoms, but some (marked with asterisks) are due to impurities commonly found in mercury. The colors and relative intensities (arbitrary scale of 0-100 for weak-to-bright) are to be used for purposes of identification. Bear in mind that different individuals react differently to colors and intensities. Therefore, Table 2 is only to be used as a guide. Table 2. Spectrum of Mercury Lamp.
*Lines due to impurities commonly found in mercury.
Determination of Wavelengths for an Unknown Source 1. Replace the mercury lamp with an unknown source such as a hydrogen discharge tube or a plain sodium lamp. Determine the angle of minimum deviation for each of the clearly visible spectral lines and calculate the corresponding value of nl . 2. Refer to the dispersion curve plotted in the previous problem. For the value of nl calculated above, determine the corresponding wavelength l given by the dispersion curve. Compare these wavelengths with the accepted wavelengths for the "unknown" sources.
Grating Spectrometer Adjustment of the Spectrometer The grating spectrometer is to be used in a manner quite similar to the prism spectrometer, with the exception that the grating will replace the prism. The collimator and telescope are to be adjusted for parallel light as previously described. Once these adjustments have been made, they are not to be disturbed for the remainder of the measurements. 1. Place the grating on the grating table as indicated in Figure 5. Not that , for proper alignment, the grating should be positioned so that its lower edge (or base), which intersects leg B of the mount, is perpendicular to the line connecting leveling mounts A and C. In order for the grating equation, ml = d sin q , to apply without error to this experimental arrangement, the mounts must be adjusted so that the grating is in a vertical plane perpendicular to the axis of the collimator. Through careful adjustment of leveling mounts, A, B, and C, the student must ensure that the plane of the grating is normal to the axis of the collimator and telescope. (If, after several trials, the student is unsure of success, he or she should consult the instructor for confirmation or assistance.) 2. Place a mercury discharge lamp so that light passing through the slit illuminates the grating. As the telescope is rotated in either direction from the on-axis alignment with the collimator, spectra should become visible. At this point, the width of the collimator slit can be adjusted and the cross hairs moved to produce a distinct image of both in the focal plane of the telescope. (Do not readjust the focus of the telescope; it must remain focused for parallel light as arranged earlier.) If, in the process of viewing different regions of the spectrum, the spectral lines move progressively higher or lower in the field of view, a slight compensating adjustment can be made with leveling screw B. Since like-orders of diffraction occur on either side of the grating normal, one can examine the spectral lines in first order, second order, and so on, on either side of the normal. One then can locate (by measurement of the angular position of the telescope) the position of all spectral lines, for both positive and negative diffraction angles q , that is, for angles on both sides of the grating normal. (Note that the angles ± q are to coincide with ± m.) Clearly, for an ideal adjustment, a given spectral line in a given order should occur in pairs, equally spaced on either side of the normal. Since ideal adjustment is not always achieved, one should average the diffraction angle q for each pair to get a "best" reading. One can obtain this average easily by noting the angular position of the pair of lines and then take one-half of the difference in the angular positions. Knowing the order of the spectral lines one is observing, the grating constant d, and the measured value of q as averaged above, one can then calculate the corresponding wavelength of each spectral line in the appropriate order with Equation 9.
The grating constant d is defined as the distance between grating slits or lines and is, thus, the reciprocal of the number of lines per unit length. The number of lines per unit length of grating is always provided by the grating manufacturer; so the constant d can be easily calculated.
Determination of Wavelengths for an Unknown Spectral Line Source 1. With the collimator and telescope adjusted for parallel light and the grating properly mounted, examine the spectral lines of the mercury discharge lamp. Locate each line as described in the preceding experimental procedure and determine its wavelength. Compare the measured wavelengths with those given in Table 2 and comment on the degree of agreement. 2. Replace the mercury lamp with the same unknown source used in the wavelength measurement with the prism spectrometer, that is, a hydrogen discharge lamp or sodium discharge lamp. Measure the wavelength of each line with the grating spectrometer; compare results with those values obtained with the prism spectrometer and with "accepted" published values.
Examination of Band Spectra in Nitrogen Replace the mercury lamp with a nitrogen capillary discharge tube and appropriate transformer. Since nitrogen is diatomic in gaseous form, one obtains so-called molecular band spectra. Observe and examine the N2 band spectra with the telescope and notice how these spectra differ from line spectra. Note that the bands (usually many of them) all are characterized by a sharp edge on one side, the so-called band head. Observe that, from the head, the band generally shades off gradually on the more intense band spectra in the visible region and compare with available data on N2 band spectra. 
1. Label the following parts of the prism spectrometer shown in Figure 10.
Fig. 10
2. Explain, in your own words, the function of each part listed in Exercise 1. 3. Define resolving power and dispersive power for both prism spectrometers and grating spectrometers. 4. Briefly outline the steps necessary to align a prism spectrometer for use in the measurement of refractive index and wavelength. 5. Referring to the dispersion curve plotted in the experiment with the prism spectrometer, determine the dispersive power for the particular prism used. Estimate the values of nF, nC, nD from the plot of nl versus l . 6. Measure the length B of the base of the prism used in this experiment. Determine a value for the dispersion D n/D l (from the dispersion curve plotted in this experiment) near 500 nm. From this data, calculate the resolving power (RP) of the prism spectrometer. (Caution: Be careful of units.) Would the resolving power calculated above be much different near 400 or 700 nm? 7. From the resolving power calculated above, determine how near two spectral lines in the 500-nm wavelength region can be and still be theoretically resolved by the prism spectrometer. 8. Explain, in your own words, the meaning of the reciprocal of the linear dispersion, 9. Calculate the theoretical resolving power of the grating spectrometer in first, second, and third order. 10. What is the wavelength difference between two adjacent spectral lines that this spectrometer theoretically can resolve near the 600-nm wavelength region? 11. You have been given a piece of glass whose indices of refraction are unknown. The glass is transparent and can be cut and polished into whatever shape you wish. Based on what you have learned in this experiment, outline a method whereby you can determine the indices of refraction in the visible part of the spectrum. 12. Suppose you had to observe the spectrum of a very weak light source. Would you use a prism or grating spectrometer? Explain your answer. 13. A parallel beam of light containing wavelengths x and y is incident on the face of a triangular glass prism having a prism angle of 60° . The indices of refraction are nx = 1.40 and ny = 1.60. If beam x goes through the prism at minimum deviation, find the following:
14. What is the angle of minimum deviation of an equiangular prism having a refractive index of 1.414? 15. A prism has an apex angle of 60° ; its refractive index is 1.54 for a HeNe laser beam (red) and 1.58 for the blue beam from a HeCd laser. If these two beams are directed so that each passes through the prism at minimum deviation, what is the angle between the two emerging laser beams?
Candler, A.C. Modern Interferometers. Hilger and Watts, Ltd. Davis, S.P. Diffraction Grating Spectrographs. New York: Holt, Rinehart and Winston, Inc., 1970. Ealing Science Teaching Catalog. (Current issue) Hecht and Zajac. Optics. Reading, MA: Addison-Wesley Publishing Co., 1974. Jenkins, Francis A. and White, Harvey E. Fundamentals of Optics. 3rd ed. New York: McGraw-Hill, 1957. Kingslake, E.R. Applied Optics and Optical Engineering. Volume III. New York: Academic Press, July, 1965. Meyer-Arendt, J.R. Introduction to Classical and Modern Optics. Englewood Cliffs, NJ: Prentice Hall. Sawyer, R.A. Experimental Spectroscopy. 3rd ed. New York: Dover Publications, Inc., 1963. Sears, Zemansky, and Young. University Physics. 5th ed. Reading, MA: Addison-Wesley Publishing Co., 1976. --------------------------------------------------------------
|
||||||||||||||||||||||||||||||||||||||||||||||||||||||||||||||||||||||||||||||||||||||||||||||||||||||||||||||||||||||||||||||||||||||||||||||||||||||||||||||||||||||||||||