| This version reflects the comments of the core participants as reviewed and incorporated in accordance with CORD's FIPSE-supported Curriculum Morphing Project. | |||||||||||||||||||||||||||||||||||||||||||||||||||||||||||||||||||||||||||||||||||||||||||||||||||||||||||||||||||||||||||||||||||||||||||||||||
MODULE 3-13 In all laser applications the laser that is chosen must have certain output characteristics determined by the application. To ensure that the laser does in fact meet required specifications, it is necessary to measure the laser output characteristics. The most common measurements are of the power of CW lasers, pulse duration and energy of pulsed lasers, and beam divergence. This module discusses basic equipment and techniques used for such measurements. Topics discussed include the type of detectors used, CW power meters and their applications, types and applications of pulse-duration detectors, the functioning of pulsed energy detectors, and methods used for measurement of beam divergence of both CW and pulsed lasers. In the laboratory the student will measure output characteristics several laser systems. 
Upon completion of this module, the student should be able to: 1. Describe the functioning of the following types of detectors:
2. Describe the applications of each of the above detectors to the measurement of CW laser power. 3. Draw a diagram of the optical components often used with photodetectors for pulsed measurement, and explain the purpose of each component. 4. Describe the two types of pyroelectric detectors and the spectral response and application of each type. 5. Explain the thermal time constant of a pyroelectric detector and its effect on detector response. 6. Draw a flow diagram accounting for al the energy incident upon a target material, and identify the factors that contribute to energy loss (energy that does not contribute to temperature rise). 7. Given the diameter of a circular aperture and the diameter of a Gaussian laser beam centered on that aperture, calculate the transmission through the aperture. 8. Given the focal length of a positive lens used to focus a laser beam, the diameter of an aperture centered on the beam at the focal length of the lens, and the transmission through the aperture, calculate the beam divergence angle. 9. Draw the experimental setup for measuring divergence angle of a CW laser beam, and describe how to take the necessary data and determine the beam divergence angle. 10. Describe the photographic method for determining beam divergence of a pulsed laser. 11. Given a densitometer scan and a description of the experimental setup, determine the divergence angle of a pulsed laser. 12. Use the equipment and techniques described in this module to determine the output characteristics of lasers in the laboratory. 
Optical Detectors The basic element in any optical power or energy measurement is the detector. It is the detector which converts the incoming optical signal into an electrical signal which is then amplified and recorded. Whether one is using a power meter, energy meter, or calorimeter, it is the detector which determines the basic operating parameters of the measuring device. Thus an understanding of these measurement devices assumes a basic understanding of the various detectors which might be used. As a result, the detector will be discussed first in this module, followed by a discussion and measurement devices and their application to the measurement of specific laser parameters. The major parameters of interest in a detector are (1) its responsivity to input optical power, i.e., how much electrical output signal is available for a given optical input, (2) its sensitivity to the wavelength of the incoming radiation, i.e., to which optical wavelengths will this detector give a measurable response, (3) its temporal response, i.e., how well does the output signal from the detector follow changes in the incoming optical signal with time, and (4) the noise inherent in the detector, i.e., how much internal noise voltage is present at the output of the detector which must be surmounted before positive identification of the signal can be made. It should be noted that parameter 3, temporal response, is extremely important for proper measurement of pulsed laser output (it is not nearly as important for CW measurements) and that parameter 4, detector noise, is extremely important in measurement of very low powers but not so important at high powers. The noise present in a detector is usually indicated by a quantity called the detectivity (D4) which is a measure of the signal-to-noise ratio of the detector. Detectors used in optical measurements can generally be characterized as photon detectors and thermal detectors. The photon detector responds to the number of individual photons incident onto the active surface of the detector whereas the thermal detector responds to total optical power. In the thermal detector this input radiation is absorbed by the detector, producing a temperature rise which then results in a change in some other parameter such as resistance, contact potential, or polarization. The common photon detectors are photoemissive detectors which operate on the basis of the photoelectric effect and solid-state semiconductor detectors which operate on the generation of charge carriers in the solid by the action of the incident photon. The common photoemissive detectors are the photomultiplier and the vacuum photodiode; the common semiconductor detectors are the photoconductor and the photodiode. The world of thermal detectors includes thermocouples, bolometers, and pyroelectrics. Each of these detectors will now be briefly discussed.
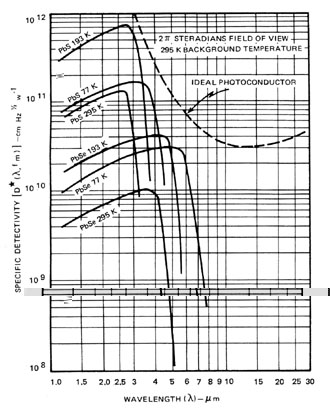
Photoconductors A photoconductor consists simply of a piece of semiconducting material in which charge carriers are generated by direct action of the incoming photons on the electrons in the detector material. This causes an increase in charge carriers in the detector which results in a decrease in detector resistance. This decrease is ultimately seen as increase of current in the external circuit. Although photoconductors can be made to be responsive to radiation from the ultraviolet to the far infrared they are primarily used for the wavelength range above one micron. Such devices have relatively high responsivities (1 to 5 aops/watt) and respond to signal changes in times as short as one microsecond. Although they are theoretically not quite as noise-free as the photodiode, they can be designed to have an inherent noise level which is only two or three times as that of the photodiode. Photoconductor response drops off on the long-wavelength end due to the fact that a minimum photon energy is necessary to generate charge carriers. On the short-wavelength and responsivity diminishes since fewer high-energy photons are available per watt of optical power. Operation of a photoconductor usually requires a reduced temperature. Thus, as can be seen from the plot of detectivity versus wavelength in Figure 1, the temperature of operation is indicated for each curve.
Fig. 1
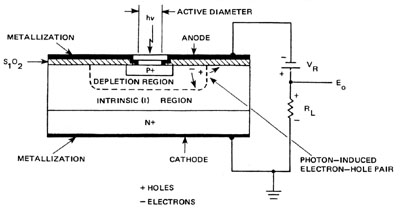
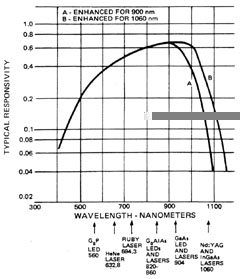
Photodiodes Photodiodes are semiconductor detectors in which the incident photon produces charge carriers in the junction region between a p-type semiconductor and an n-type semiconductor. This junction region, which is only a few microns in width, has the potential of the order of a volt across it, thus leading to very large fields of the order of 10,000 volts/cm. Carriers produced in his junction region are thus quickly swept out into the external circuitry where they produce a measurable indication on a meter or as a scope trace. A junction device of this nature has a maximum gain of one, resulting in a responsivity which is normally lower than that of the photoconductor. Due to the fact that detgction occurs as a result of carrier production in the high field junction region, the temporal response of a photodiode is considerably faster than that of a photoconductor; typically in the order of nanoseconds. Photodiodes are available which are responsive to wavelengths from the ultraviolet through the near infrared. Internal noise in the photodiode is quite low, providing for a high signal-to-noise ratio. There are several types of photodiode detectors available, such as the p-n junction, PIN photodiode, and the avalanche photodiode. The most common photodiode detector is the PIN photodiode. In this device there is a region of intrinsic semiconductor material between the p and n regions. This is shown schematically in Figure 2. This intrinsic region serves to increase the width of the junction, which in turn provides for more efficient conversion of photons to charge carriers. These devices can be operated in either a photoconductive or photovoltaic mode. (Do not confuse the photoconductive mode of a photodiode with the photoconductor discussed above.) Photovoltaic operation is obtained when there is no bias voltage applied to the diode. The output voltage produced across the load resistor increases as the signal level increases. Photoconductive operation, on the other hand, is obtained when the diode is back-biased so that it becomes a current source. Biasing of the detector results in a slightly increased noise and a higher dark current; however, the frequency response is extended, a feature which is extremely useful when faster laser pulses are being examined. Silicon PIN photodiode detectors are probably the most widely used laser detectors in the visible and near infrared regions of the spectrum. The response of a typical PIN silicon photodiode is shown in Figure 3.
Fig. 2
Fig. 3
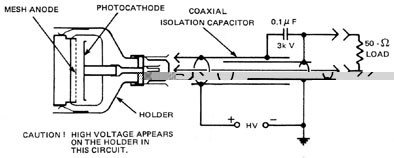
Vacuum Photodiodes Vacuum photodiodes are simple photoemissive devices which are useful from the ultraviolet to the near infrared (1.1 microns). A typical vacuum photodiode is shown in Figure 4. In this device an incoming photon strikes the photocathode, causing a photoelectron to be emitted into the vacuum. This electron then travels to the anode where it is collected. The resulting current appears as a signal in the external circuit. The advantage of the vacuum photodiode lies in its very high frequency response (up to 2 GHz) and its ability to handle high incident powers. As semiconductor photodiodes are improved they are increasingly replacing the vacuum photodiode in most applications.
Fig. 4
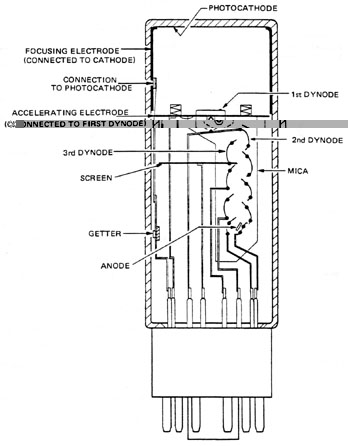
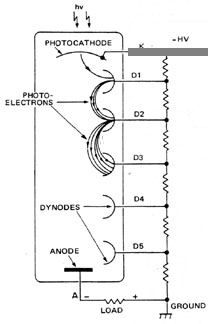
Photomultipliers Photomultipliers, such as that shown in Figure 5, are similar to vacuum photodiodes in that the incident photon causes the emission of an electron from the photocathode into the vacuum. In this case, however, the electron is subsequently amplified before collection at the anode. The amplifier consists of a series of plates, called dynodes, which have specifically prepared surfaces. As can be seen from Figure 6, a negative potential of approximately 1000 volts is applied to the photocathode and across a voltage divider. This produces equal voltage steps across the dynodes. A photon striking the photocathode causes an electron to be emitted. The electron is accelerated by the potential applied to the first dynode where its kinetic energy is sufficient to free several more electrons. These accelerate to the second dynode where the process is repeated, and so on for the entire dynode chain. The electrons leaving the final dynode are then collected by the anode. Since as many as 106 electrons can arrive at the anode as a result of a single incident, photon, high gain (and thus high responsivity) characterizes a photomultiplier. As a result, photomultipliers are capable of measuring extremely low light levels, but they do require a high voltage supply and are easily damaged by exposure to irradiance levels above their design range. Photomultipliers are sensitive to the same range of wavelengths that photodiodes are, i.e., ultraviolet to near infrared (1.1 m m). The temporal response of a photomultiplier is excellent; pulses in the nanosecond range can be accurately followed. Noise levels are very low and the presence of internal amplification stages guarantees some of the highest signal-to-noise ratios available in any detector.
Fig. 5
Fig. 6
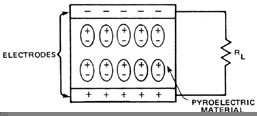
Pyroelectric Detectors Pyroelectric materials are nonconductors in which the electrical polarization is a function of the temperature of the material. Figure 7 illustrates the basic construction of a pyroelectric detector. It consists of a slab of pyroelectric material with electrodes deposited on the surface where the polarization appears. The charge on the electrodes corresponds to the polarization of the material and thus to its temperature. When the temperature changes, current flows through the load resistor. Thus, pyroelectric detectors respond to the change in detector temperature and cannot be used for direct measurement of CW laser power. For CW radiometers the input beam to the pyroelectric detector is converted to a pulsed input by a light chopper. The system is calibrated to indicate the true CW power of the beam. Pyroelectric radiometers are useful from the blue end of the visible spectrum through the far infrared for low-power beams. They are most important in IR regions where other low-light-level detectors cannot be used.
Fig. 7
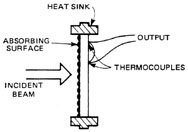
Bolometers Bolometers are detectors which measure power by sensing a change of resistance brought about by the heating effect of the laser beam. Bolometers are thus basically temperature-sensitive resistors. Such resistors are usually made of a semiconducting material and are called thermistors. They are neither highly sensitive nor do they have a fast temporal response; however, they are simple, reliable, and inexpensive and are thus used as the sensing element in several power meters. They are useful for CW measurements but, due to their slow time response, are not useful for pulsed measurements. Thermopiles Thermopiles are detectors that measure beam power by measuring temperature differences within the detector that are produced by the heating effect of the laser beam. Figure 8 is a diagram of a common thermopile for CW laser power measurement. It consists of a metal disk connected to a heat sink at its edge. This heat sink may be either air-cooled or water-cooled. Thermocouples located at the center of the disk and the outer edge are connected in series to produce a voltage that is proportional to the temperature difference from disk center to edge. During CW power measurements, the thermopile operates in a steady state with a constant heat flow and constant temperature difference. When the power changes, new thermal equilibrium conditions must be reached before the reading will be accurate. Thus, the response time of a typical thermopile is greater than two seconds. This is a serious disadvantage when rapid changes in beam power are of importance.
Fig. 8
Thermopiles are useful for all wavelengths at power levels above one watt. Air-cooled detectors are used for powers up to 300 W, and water-cooled models may measure powers of a few kilowatts. Cone calorimeters are also sometimes used for CW power measurement.
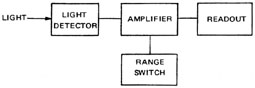
Power Meters and Their Applications Optical power meters are used to measure the power from a CW laser. They are commercially available for use at all laser wavelengths and for power ranges from nanowatts to kilowatts. All power meters contain the four basic elements shown in Figure 9. Light striking the detector results in a current flow through the detector. The amplitude of the current is proportional to the total optical power striking the detector for power within the detector design range. This current is amplified and used to drive the meter readout device. This may be a microammeter or a digital display. The power range of the meter normally is selected with a range switch that controls the gain of the internal amplifier.
Fig. 9
The optical system of the power meter usually contains elements that control the light striking the detector. These may include a rotating chopper blade that allows only a fraction of the incident laser beam to strike the detector, an ambient light shade to reduce unwanted stray light, and filters to allow only certain wavelengths to pass to the detector. Most power meters respond with different sensitivities at different wavelengths. They generally are calibrated for a specific wavelength, and calibration curves are used to determine true power at other wavelengths. More information on power meter design and calibration is given in Module 1-2, "Optical Power Meters." The remainder of this section discusses the detectors used in power meters and their applications.
Pulse-Duration Measurement To accurately display the time history of a laser pulse, the detector must respond quickly to changes in incident power. Response time of the detector usually is limited by the RC time constant of the electrical circuit. The capacitance is the capacitance of the detector itself and may be reduced by reducing the detector size. Thus, fast detectors for pulse-shape monitoring are generally small and cannot withstand much input energy. The two detector types used in most cases are the PIN photodiode and the pyroelectric detector.
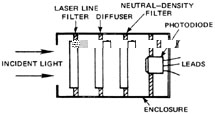
Photodiodes for Pulse Measurement A wide variety of fast photodiodes are available for various wavelength ranges from the ultraviolet to the far infrared. UV, visible, and near IR photodiodes operate at room temperature. Those for wavelengths beyond about 2 m must be operated at cryogenic temperatures. Figure 10 shows some of the optical elements commonly used with photodiodes (and other detectors as well). The laser line filter blocks all light except the laser wavelength. The diffuser spreads the incident beam to produce uniform irradiance on the detector surface. The neutral-density filter reduces the irradiance to a level that is within detector limits. The elements used in any particular measurement application depend upon the light to be measured.
Fig. 10
In some cases the laser radiation has sufficient irradiance to bleach the neutral-density filters, reducing their absorption and resulting in detector damage. In such cases the beam power must be reduced before the beam enters the detector assembly.
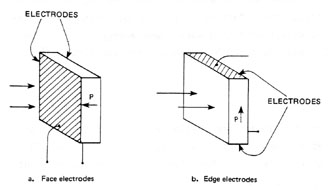
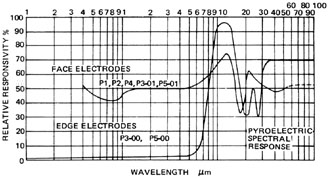
Pyroelectric Detectors for Pulse Measurement Two configurations of pyroelectric detectors are shown in Figure 11. In the face-electrode type, the laser radiation is incident upon the electrode surface. Coatings may be used to enhance absorption. In the edge-electrode type, the radiation is incident directly upon the pyroelectric material. The spectral response curves of both types are shown in Figure 12. Edge-electrode detectors have higher damage thresholds, particularly at short pulse durations.
Fig. 11
Fig. 12
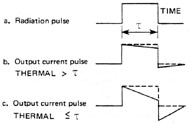
The thermal time constant of a pyroelectric detector is a measure of the rate at which thermal energy is transferred from the detector to its surroundings. Short thermal time constants indicate good thermal transfer and higher energy-per-pulse capability. Longer time constants indicate slower energy transfer and a correspondingly lower energy-per-pulse capability. Figure 13 illustrates the effect of the thermal time constant on output pulse shape. A square input pulse delivers energy to the detector at a constant rate. If no thermal energy is lost from the detector, its temperature rises constantly, producing a square output pulse. Because some energy loss does occur, the output pulse shape will droop slightly, as indicated in Figure 13b. If the pulse duration exceeds the thermal time constant, the pulse will be greatly distorted, as shown in Figure 13c. Thus, pyroelectric detectors designed for high-speed operation may not perform well for long pulses.
Fig. 13
Pulse Energy Measurement The energy of a laser pulse is most often measured by causing the pulse to be absorbed by a material and then measuring the temperature increase that results from the absorbed lasgr energy. A device that accomplishes this measurement is called a calorimeter.
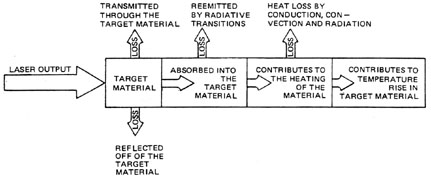
Principles Of Calorimetry Calorimetry is the measurement of heat energy. When heat energy is added to a substance, its temperature increases (assuming there is no change in state). The temperature rise depends upon the heat capacity and mass of the material and the quantity of heat added. If heat capacity, mass, and the temperature rise are known, the energy added to the system may be calculated. Laser calorimeters respond to the temperature increase of the detector and are calibrated in energy units (joules). Chief factors that affect calorimeter performance are the fraction of total beam energy contributing to the temperature increase, and the ability of the sensing element to measure the temperature increase. Figure 14 is an energy-flow diagram that accounts for all the light energy striking a calorimeter. The factors identified as loss do not contribute to the temperature increase. All these factors must be accounted for in calibrating a calorimeter. A calorimeter for pulsed energy measurement must allow little of the incident beam to escape unabsorbed, must be designed so that reemitted radiation is minimized or reabsorbed, and must heat slowly by conduction and convection.
Fig. 14
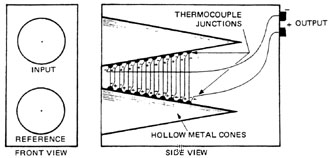
Thermoelectric Calorimeters The most common type of calorimeter employs thermocouple junctions to sense the temperature increase of an absorbing element. Figure 15 shows the cone calorimeter most often used for measuring the energy of a single laser pulse. The calorimeter consists of two hollow metal cones. Thermocouple junctions connected to the cones and wired in series sense temperature difference. The lower cone is the temperature reference and is at room temperature. The laser beam is directed into the upper cone and is absorbed. Most of the laser radiation and reemitted radiation are absorbed. After several seconds, heat energy is evenly distributed throughout the input cone and it reaches an almost constant temperature. This produces the maximum thermocouple output, and the energy measurement is based on this value. Digital displays automatically record and display the maximum value expressed in joules. When meter movements are used, the needle moves to a maximum value and then drops as the input cone cools. Energy of the pulse is indicated by maximum needle deflection.
Fig. 15
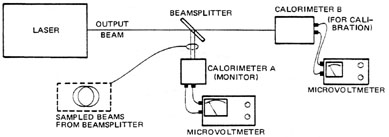
Use of Calorimeters Most calorimeters respond to a wide range of wavelengths and may be used with a variety of lasers. Measurements are easy and accurate when the entire laser beam and no other radiation enters the calorimeter. Problems arise when only a portion of the laser radiation enters the measuring device or when other radiation is present. Measurements should never be made with the detector located near the laser output aperture as flashlamp light and fluorescence will influence the results. If beam-handling optics are used, their effect must be calculated and accounted for in determining pulse energy. Figure 16 illustrates calibration of an energy monitor installed in a laser system. A beamsplitter directs a small fraction of the laser light to monitor calorimeter A. Calibration is achieved by measuring the total pulse energy with calorimeters A and B and accounting for any losses. The micro-volt meter connected to the monitor calorimeter is then adjusted to read total beam energy, and calorimeter B is removed from the system.
Fig. 16
Measuring Beam Divergence of CW Lasers The far-field beam divergence of a laser is the constant beam divergence angle at a large distance from the laser output aperture. Near the laser this beam divergence is not constant. Thus, measurements made in the near field cannot be used to predict far-field behavior of the beam. This section discusses principles and techniques employed for beam-divergence measurements.
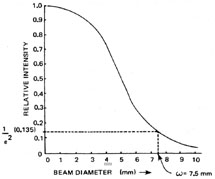
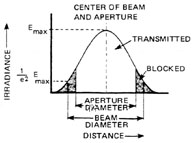
Principles of Beam-Divergence Measurement The basic principle of beam-divergence measurement is that the wavefronts of a laser beam have the same shape at the focal point of a positive lens as in the far field. Thus, measurements made at such a focal point are far-field measurements. The beam divergence may be determined by measuring the beam diameter at the focal point of a positive lens and then calculating the divergence angle. The beam diameter may be determined by measuring the transmission of the beam through an aperture. If a laser beam is centered on a circular aperture, the edges of the beam may be blocked as shown in Figure 17. The fraction of the total beam power transmitted through the aperture is given by Equation 1.
Fig. 17
Example A illustrates the use of Equation 1.
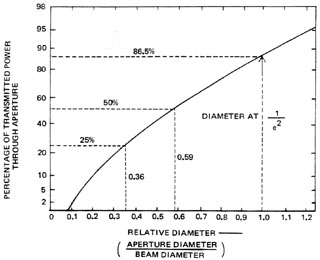
Figure 18 is a transmission curve based on Equation 1. The horizontal scale is calibrated in the ratio of aperture diameter to beam diameter. The vertical scale is calibrated in percent transmission. This curve may be used with a calibrated aperture to determine the diameter of a laser beam as illustrated in Example B.
Fig. 18
Equation 1 may be rearranged to yield Equation 2.
Example C shows the use of Equation 2 in solving the same problem that was solved by the use of Figure 18 in the previous example.
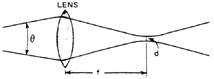
Figure 19 shows a laser beam being focused by a positive lens. Diameter of the focused spot to the 1/e2 points is given by Equation 3.
Fig. 19
If the diameter of the focused spot and the focal length of the lens are known, Equation 3 may be used to determine the divergence angle as illustrated in Example D.
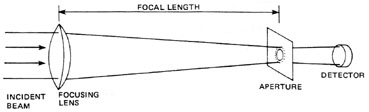
Experimental Technique Figure 20 shows the experimental setup used to measure the beam divergence of a CW laser. A positive lens is used to focus the beam onto a calibrated aperture located at the focal plane of the lens. The lens chosen should have a focal length of at least 10 times the diameter of the beam at the lens to reduce spherical aberration. A factor of 100 times should be used if possible. The aperture is positioned for maximum transmission, and the transmitted power is measured. The aperture is then removed and the power of the unobstructed beam is measured. The two power measurements and the aperture diameter are used in Equation 2 to determine the diameter of the focused spot. This diameter and the focal length of the lens are then used in Equation 3 to determine the divergence angle of the beam. This procedure is illustrated in Example E.
Fig. 20
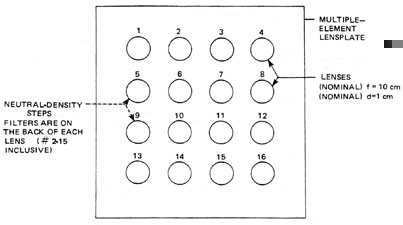
Measuring Beam Divergence of Pulsed Lasers Beam-divergence measurements for pulsed lasers are based on the same principles as for CW lasers, although different measurement techniques may be used. For repetitively-pulsed lasers the techniques are the same as for CW lasers. Transmission through the aperture may be based on average power measurements for high repetition rates or an energy-per-pulse measurements for lower pulse rates. The beam divergence of many "single shot" pulsed lasers also may be measured by this technique. This method accurately indicates beam divergence of any Gaussian beam. For nonGaussian beams a more detailed examination of the energy distribution is often required. For CW lasers this may be accomplished by scanning the beam with a small-aperture detector. For pulsed lasers photographic methods may be used. The method described here provides an irradiance plot of the beam and may also be used to determine beam divergence. The experimental technique consists of focusing the beam on a target and producing a series of photographs from which data may be obtained. Figure 21 shows the multiple-element lens plate used in this procedure. It contains 16 identical lenses. Neutral-density filters behind 15 of these lenses produce exposures of varying density. The filters are chosen so that each transmits less light than the previous one and so the transmission steps from one to the next are almost equal.
Fig. 21
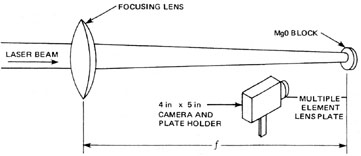
Figure 22 shows the experimental setup. The laser beam is focused with a long-focal-length lens as in other beam-divergence measurement techniques. It strikes a magnesium carbonate or magnesium oxide block at the focal plane of the lens. A camera with the multiple-element lens plate is positioned to photograph the focused beam. The irradiance on the block should be less than 100 mW/cm2 to prevent ablation or vaporization of the target material. The camera should be positioned no closer than 30 cm to the block so that all lens elements receive the same amount of light. The laser is fired at the block and the focused spot is photographed. The film is developed, and densitometer scans of the exposed areas are made to reveal the energy distribution of the beam.
Fig. 22
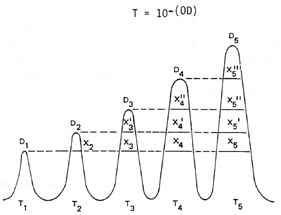
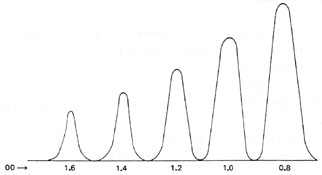
Figure 23 shows the densitometer scan of a Gaussian laser beam. The following method may be used to determine the beam divergence from this data.
Fig. 23
The values of Ti are the transmission of the filters. If the optical density of the filters is known, the transmission may be determined using Equation 4.
A horizontal line is drawn across the scan from the peak of the spot of lowest density. X2 is the distance across the T2 curve at this level. This represents the diameter of the spot for which the radiant intensity exceeds (T1/T2) times the maximum radiant intensity. X3 represents the diameter for which the radiant intensity exceeds (T1/T3) times the maximum intensity. This produces a set of data points that may be graphed to yield relative intensity versus diameter. Additional data points may be determined by repeating the process for lines drawn from the peak of other curves. Thus X31 represents the diameter for which the intensity exceeds the maximum by (T2/T3) times the maximum. After the graph is drawn, the geometry of the experimental setup is used to determine the actual the actual dimensions of the beam. This technique is illustrated by Example F.
Summary The output powers of CW lasers are measured with a variety of power meter types depending on the output power level and the laser wavelength. Photodiodes are used for powers of less than one watt (somewhat more with proper attenuators) in the ultraviolet, visible, and near IR portions of the spectrum. Photomultiplier tubes are used in the same region for the measurement of very low light levels. Thermopiles are used for powers above one watt throughout the entire spectral range of laser operation. Their primary disadvantage is their slow response time. Pyroelectric detectors may be used for CW power measurements up to a few watts throughout the visible and the infrared. They have choppers to produce a pulsed input to the detector and are popular only for those IR wavelengths and power levels not covered by less expensive detectors. Pulse duration measurements are accomplished by photodiodes or pyroelectric detectors, depending upon the laser wavelength. Beam-divergence measurements are accomplished by focusing the beam with a positive lens of known focal length. The beam diameter at the focal spot is measured and used to determine the far-field beam divergence.
1. Explain the operation of the following detectors:
2. Explain the function of thermoelectric detectors for the measurement of CW laser power and pulse energy. 3. Draw a diagram of the optical components commonly used with photodetectors, and explain the function of each. 4. Describe two basic types of pyroelectric detectors. Explain the advantages and disadvantages of each, including the spectral region for which they are useful. 5. Describe the effect of the thermal time constant on pyroelectric detector performance. 6. A laser with a divergence angle of 1.0 mrad and output power of 0.68 W is focused onto an aperture with a diameter of 1.0 mm by a lens with a focal length of 120 cm. Determine the transmitted power. 7. A laser beam is focused with a lens of focal length of 2 m and is found to have a focused spot with a diameter of 0.8 mm. Determine the beam divergence angle. 8. A 250-mW laser beam is focused with a lens of focal length of 1 m onto an aperture with a diameter of 1.5 mm. The transmitted power is 225 mW. Determine the beam divergence angle. 9. State the detector type most likely for the following measurements:
10. A ruby laser pulse was focused onto an Mg0 block with a 2-m lens. The following densitometer scan was produced from the photograph taken with a multiple-lens camera with a magnification of 0.33. The densitometer scan has a magnification of 20. Use the method described in this module to determine the beam divergence to the 1/e2 points.

Equipment and materials for the laboratory will be specified by the lab instructor. Equipment should consist of a minimum of two laser systems, one CW and one pulsed, and all the equipment necessary to determine the output characteristics of the lasers.
The purpose of this laboratory exercise is to provide the student with practical experience in using the equipment and techniques described in this module to measure the output characteristics of lasers. Students should be familiar with the operation of all lasers to be used before the lab begins. Students should read the instruction manuals and data sheets from all detectors and other equipment to be used before beginning the laboratory. No detailed procedures are provided with this laboratory. Students must devise their own experimental procedures and list them as part of their lab report.
LABORATORY REPORT The report for this laboratory consists of a brief but complete report on the output characteristics of each laser measured. Each report should include the following elements: 1. List of all equipment used, including a description of the laser system. 2. Outline of the experimental procedures followed. All calculations required. 3. Description of the laser output including beam divergence, power for CW lasers, pulse energy, and duration for pulsed lasers. 
O’Shea, Donald C.; Callen, Russell W.; Rhodes, William T. Introduction to Lasers and Their Applications. Reading, MA: Addison-Wesley Publishing Co., 1977. Ready, John F. Industrial Applications of Lasers. New York: Academic Press, 1978.
|
|||||||||||||||||||||||||||||||||||||||||||||||||||||||||||||||||||||||||||||||||||||||||||||||||||||||||||||||||||||||||||||||||||||||||||||||||

 since r =

 Equation
2
Equation
2